Copyright
©2012 Baishideng Publishing Group Co.
World J Radiol. Jul 28, 2012; 4(7): 291-301
Published online Jul 28, 2012. doi: 10.4329/wjr.v4.i7.291
Published online Jul 28, 2012. doi: 10.4329/wjr.v4.i7.291
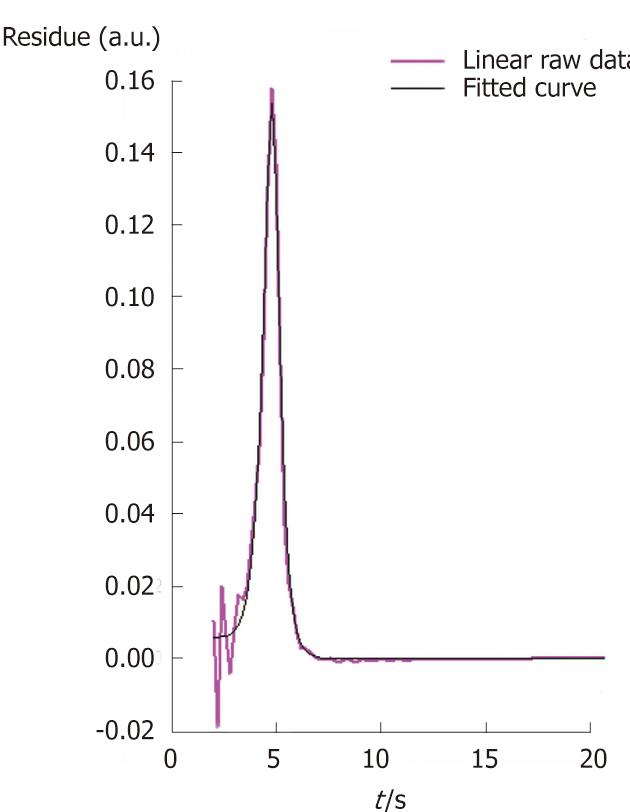
Figure 2 Graph displaying an example of a residue function.
From this curve, three quantitative microvascularization parameters are graphically extracted: Blood flow corresponds to the maximum value reached by the residue function, blood volume is defined as the area under the curve and the mean transit time is defined as the ratio between blood volume and blood flow.
- Citation: Gauthier M, Pitre-Champagnat S, Tabarout F, Leguerney I, Polrot M, Lassau N. Impact of the arterial input function on microvascularization parameter measurements using dynamic contrast-enhanced ultrasonography. World J Radiol 2012; 4(7): 291-301
- URL: https://www.wjgnet.com/1949-8470/full/v4/i7/291.htm
- DOI: https://dx.doi.org/10.4329/wjr.v4.i7.291


