Copyright
©2012 Baishideng Publishing Group Co.
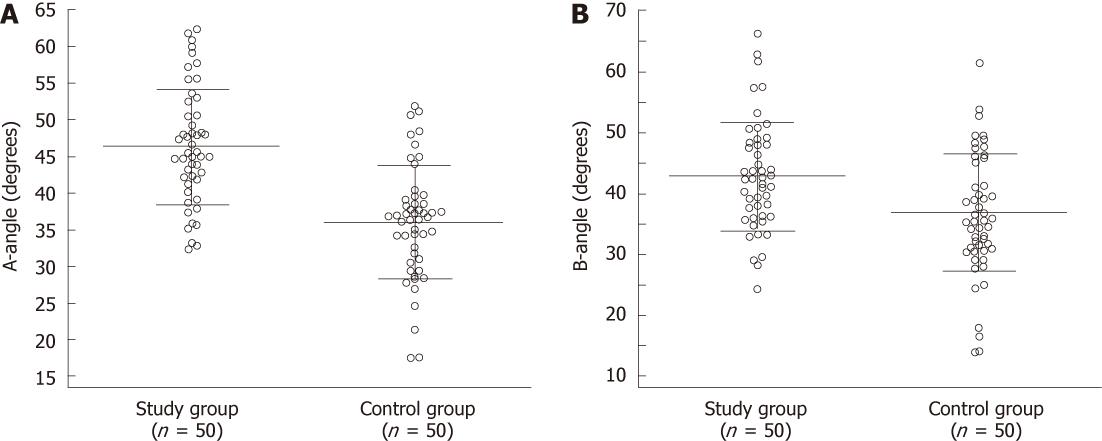
Figure 2 Graphic demonstration of the results obtained during measurements of the A-angle (A) and B-angle (B) in the two groups of the study.
On each column, a set of horizontal lines represents the average value (long line) ± SD (short lines).
- Citation: Chalian M, Soldatos T, Carrino JA, Belzberg AJ, Khanna J, Chhabra A. Prediction of transitional lumbosacral anatomy on magnetic resonance imaging of the lumbar spine. World J Radiol 2012; 4(3): 97-101
- URL: https://www.wjgnet.com/1949-8470/full/v4/i3/97.htm
- DOI: https://dx.doi.org/10.4329/wjr.v4.i3.97


