Copyright
©2012 Baishideng Publishing Group Co.
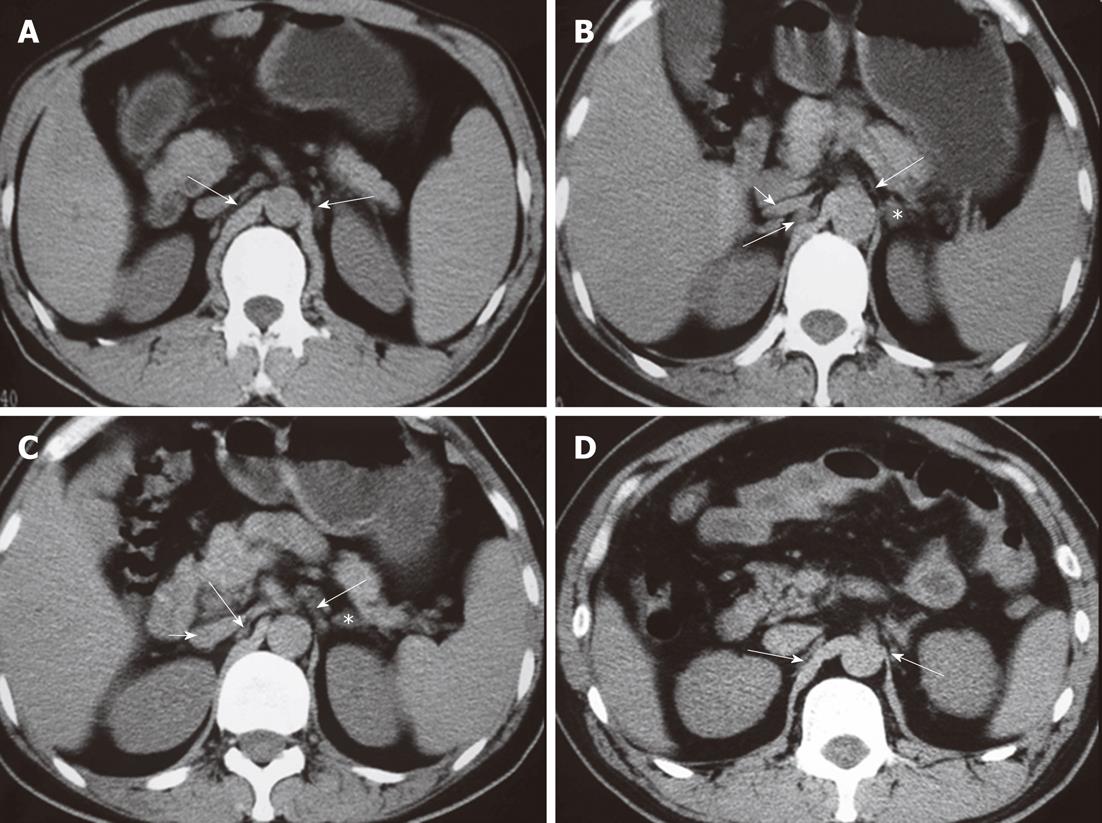
Figure 12 Computed tomography images show the celiac ganglia at different levels.
A: A celiac ganglion (long arrows) at the root of the superior mesenteric artery; its density is the same as the liver and spleen or slightly less than the diaphragma crura; B: The celiac ganglia (long arrows) at the level of the pancreatic head and neck. The left celiac ganglia were lamina-shaped and located lengthwise in the space in the front of the left adrenal gland (*); the right celiac ganglia were a thick, line-shaped structure dorsal to the inferior vena cava (IVC) and lateral to the right diaphragma crura; C: A celiac ganglion (long arrows) at the level of the root of the celiac trunk. It appeared lamina- and nodule-shaped; D: The celiac ganglia (long arrows) at the level of the uncinate process, with well-defined margins. The left ganglia were lamina-shaped and located lengthwise in the space to the front and the left of the adrenal gland (*); the right ganglia were thick and line-shaped, located dorsal to the IVC and lateral to the right diaphragma crura. Short arrows indicate IVC (B, C).
- Citation: Zuo HD, Zhang XM, Li CJ, Cai CP, Zhao QH, Xie XG, Xiao B, Tang W. CT and MR imaging patterns for pancreatic carcinoma invading the extrapancreatic neural plexus (Part I): Anatomy, imaging of the extrapancreatic nerve. World J Radiol 2012; 4(2): 36-43
- URL: https://www.wjgnet.com/1949-8470/full/v4/i2/36.htm
- DOI: https://dx.doi.org/10.4329/wjr.v4.i2.36


