Copyright
©2012 Baishideng Publishing Group Co.
World J Radiol. Nov 18, 2012; 4(11): 443-449
Published online Nov 18, 2012. doi: 10.4329/wjr.v4.i11.443
Published online Nov 18, 2012. doi: 10.4329/wjr.v4.i11.443
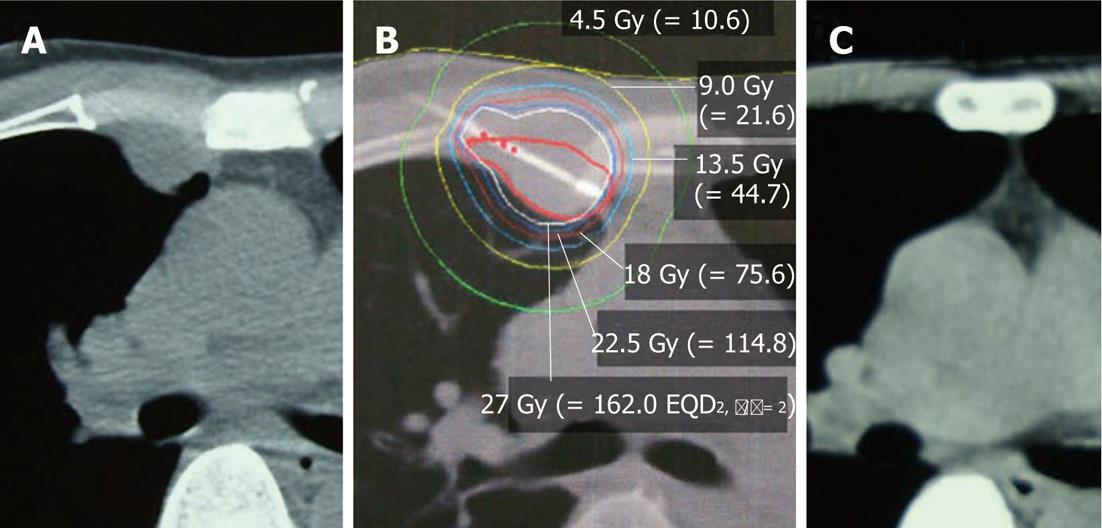
Figure 4 X-ray computed tomography (A) and brachytherapy dose distribution (B) images of the second lesion.
Computed tomography image shows no tumor recurrence at 1 year after treatment (C). The attachment pattern of the anterior mediastinum changed with breath holding. In images (A) and (B), slices were obtained at the maximal cross-section of the tumor. Isodose curves are 150%, 125% (thin line), 100% (18 Gy), 75%, 50% and 25%, from innermost to outermost.
- Citation: Kishi K, Tanino H, Sonomura T, Shirai S, Noda Y, Sato M, Okamura Y. Novel eradicative high-dose rate brachytherapy for internal mammary lymph node metastasis from breast cancer. World J Radiol 2012; 4(11): 443-449
- URL: https://www.wjgnet.com/1949-8470/full/v4/i11/443.htm
- DOI: https://dx.doi.org/10.4329/wjr.v4.i11.443


