Copyright
©2012 Baishideng Publishing Group Co.
World J Radiol. Oct 28, 2012; 4(10): 421-430
Published online Oct 28, 2012. doi: 10.4329/wjr.v4.i10.421
Published online Oct 28, 2012. doi: 10.4329/wjr.v4.i10.421
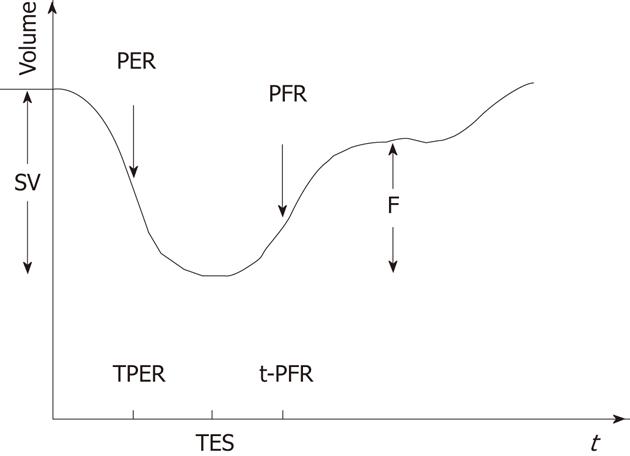
Figure 3 Left ventricular time activity curve from the first derivative showing different phases of cardiac cycle and parameters obtained.
SV: Stroke volume; PER: Peak emptying rate; TPER: TIme at peak emptying rate; PFR: Peak filling rate; t-PFR: Time to peak filling rate; TES: Time to end of systole; F: Part of SV achieved during rapid filling rate.
- Citation: Mitra D, Basu S. Equilibrium radionuclide angiocardiography: Its usefulness in current practice and potential future applications. World J Radiol 2012; 4(10): 421-430
- URL: https://www.wjgnet.com/1949-8470/full/v4/i10/421.htm
- DOI: https://dx.doi.org/10.4329/wjr.v4.i10.421


