Copyright
©2012 Baishideng Publishing Group Co.
World J Radiol. Oct 28, 2012; 4(10): 421-430
Published online Oct 28, 2012. doi: 10.4329/wjr.v4.i10.421
Published online Oct 28, 2012. doi: 10.4329/wjr.v4.i10.421
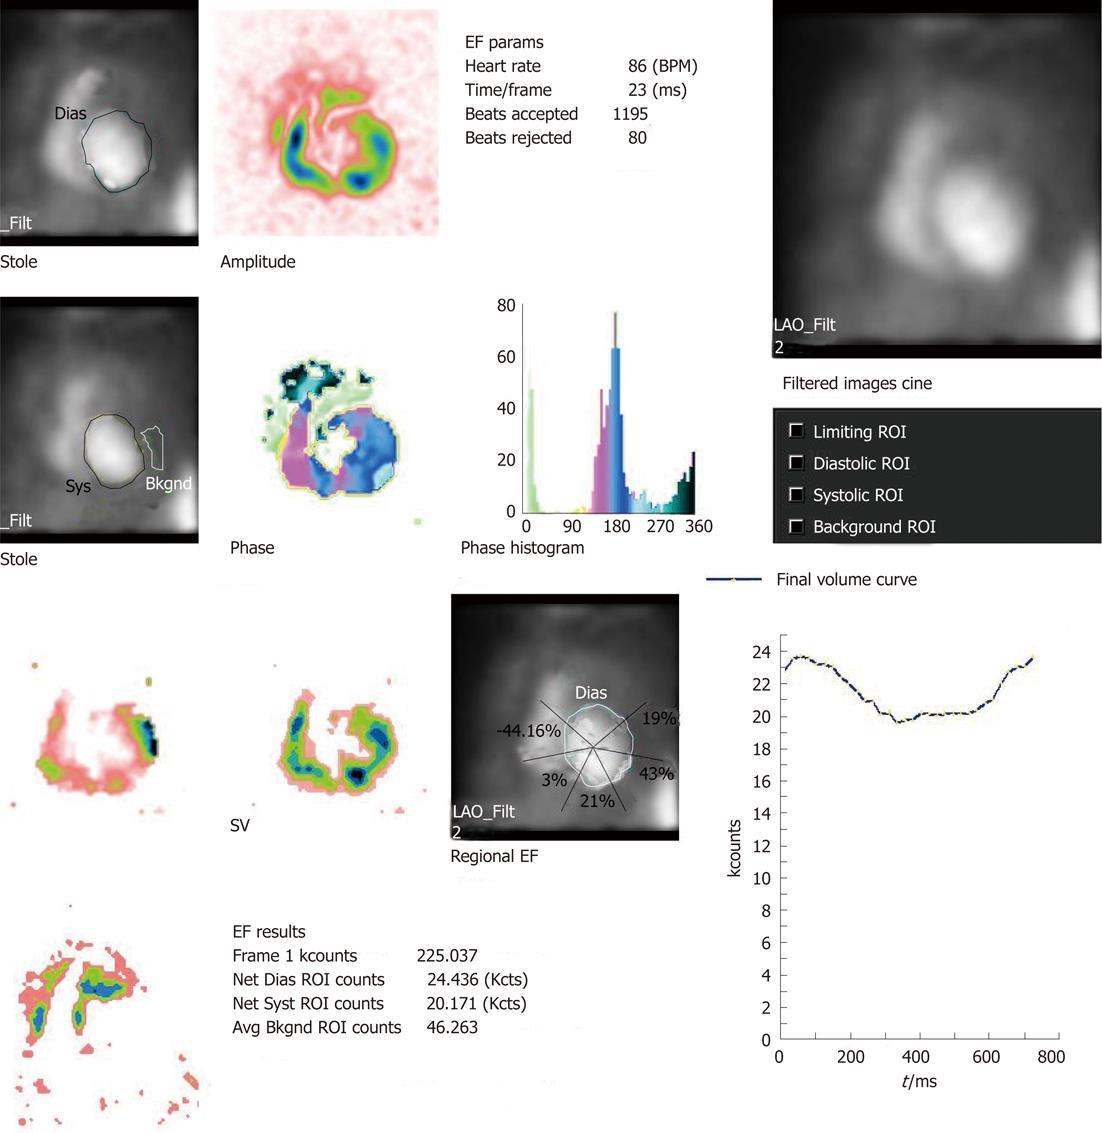
Figure 2 Multigated acquisition scan shows significantly reduced left ventricular ejection fraction of 17%.
The phase image shows dyssynchronous contraction in left ventricular (LV) myocardium and there is overlap of phases both in left and right ventricular myocardium. The width of the phase histogram is more than normal suggesting intra- and inter-ventricular dyssynchrony. The image also demonstrates regional ejection fraction (EF). The paradox image does not show any region of myocardium in paradox. The left ventricular time activity curve is abnormal. ROI: Region of interest; LAO: Left anterior oblique; SV: Stroke volume; Syst: Systolic; Dias: Diastolic; Avg Bkgnd: Average backgroud..
- Citation: Mitra D, Basu S. Equilibrium radionuclide angiocardiography: Its usefulness in current practice and potential future applications. World J Radiol 2012; 4(10): 421-430
- URL: https://www.wjgnet.com/1949-8470/full/v4/i10/421.htm
- DOI: https://dx.doi.org/10.4329/wjr.v4.i10.421


