Copyright
©2011 Baishideng Publishing Group Co.
World J Radiol. Jul 28, 2011; 3(7): 169-177
Published online Jul 28, 2011. doi: 10.4329/wjr.v3.i7.169
Published online Jul 28, 2011. doi: 10.4329/wjr.v3.i7.169
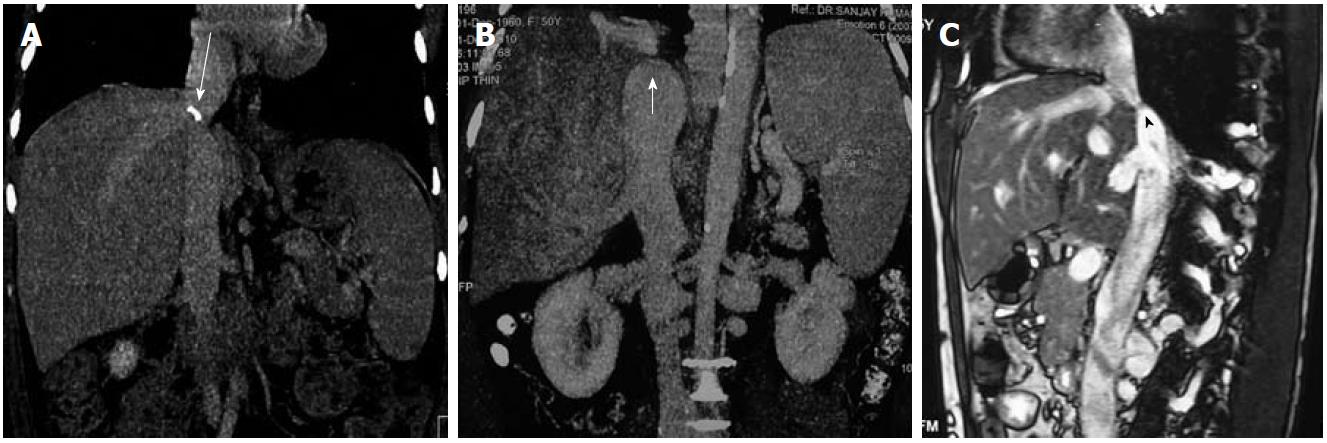
Figure 6 Inferior vena cava.
A, B: Computed tomography images (coronal reformatted) show calcified (long arrow) and non-calcified inferior vena cava (IVC) web (short arrow); C: Sagittal T2 weighted magnetic resonance imaging shows membranous occlusion of IVC (arrowhead).
- Citation: Mukund A, Gamanagatti S. Imaging and interventions in Budd-Chiari syndrome. World J Radiol 2011; 3(7): 169-177
- URL: https://www.wjgnet.com/1949-8470/full/v3/i7/169.htm
- DOI: https://dx.doi.org/10.4329/wjr.v3.i7.169


