Copyright
©2011 Baishideng Publishing Group Co.
World J Radiol. Jul 28, 2011; 3(7): 169-177
Published online Jul 28, 2011. doi: 10.4329/wjr.v3.i7.169
Published online Jul 28, 2011. doi: 10.4329/wjr.v3.i7.169
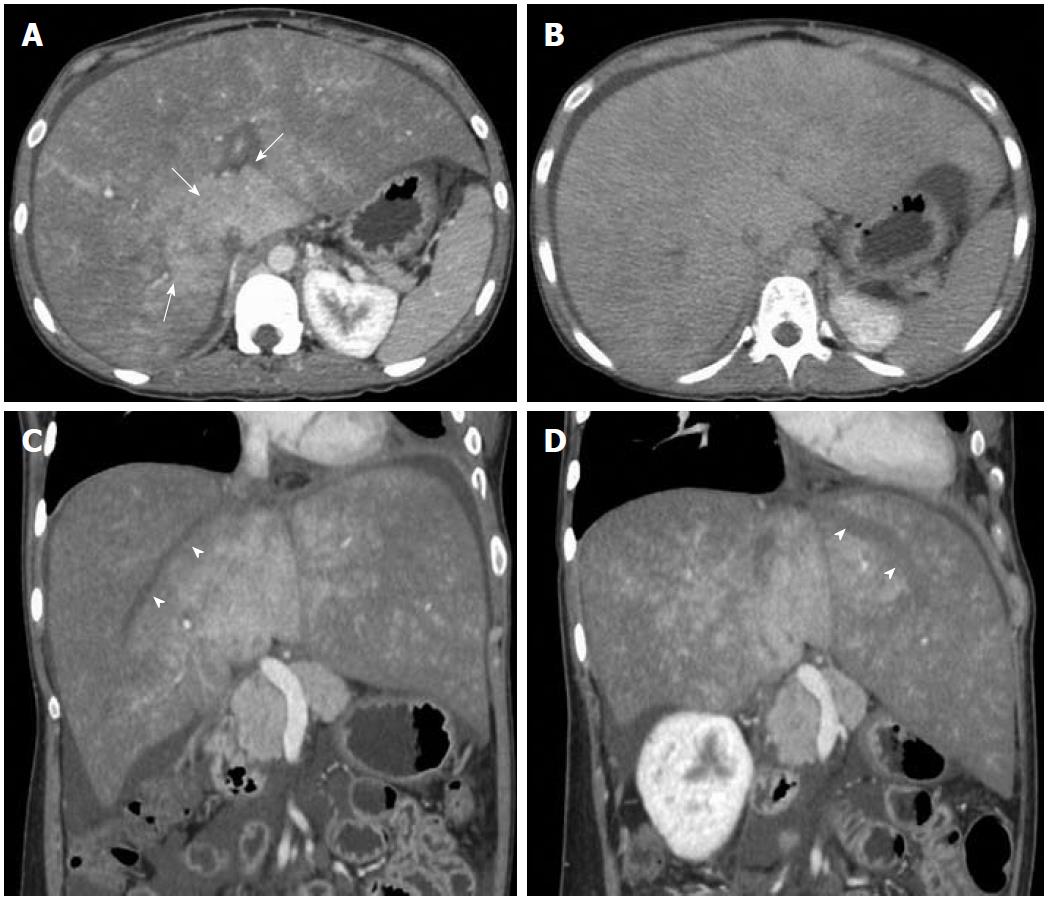
Figure 5 Axial computed tomography images.
Portal venous phase image (A) shows heterogeneous and mottled enhancement pattern with central prominence (arrows) which becomes more homogeneous in delayed phase (B). Oblique reformatted images (C, D) along the axis of the right and left hepatic veins show unopacified hepatic veins (arrowheads).
- Citation: Mukund A, Gamanagatti S. Imaging and interventions in Budd-Chiari syndrome. World J Radiol 2011; 3(7): 169-177
- URL: https://www.wjgnet.com/1949-8470/full/v3/i7/169.htm
- DOI: https://dx.doi.org/10.4329/wjr.v3.i7.169


