Copyright
©2011 Baishideng Publishing Group Co.
World J Radiol. Apr 28, 2011; 3(4): 105-113
Published online Apr 28, 2011. doi: 10.4329/wjr.v3.i4.105
Published online Apr 28, 2011. doi: 10.4329/wjr.v3.i4.105
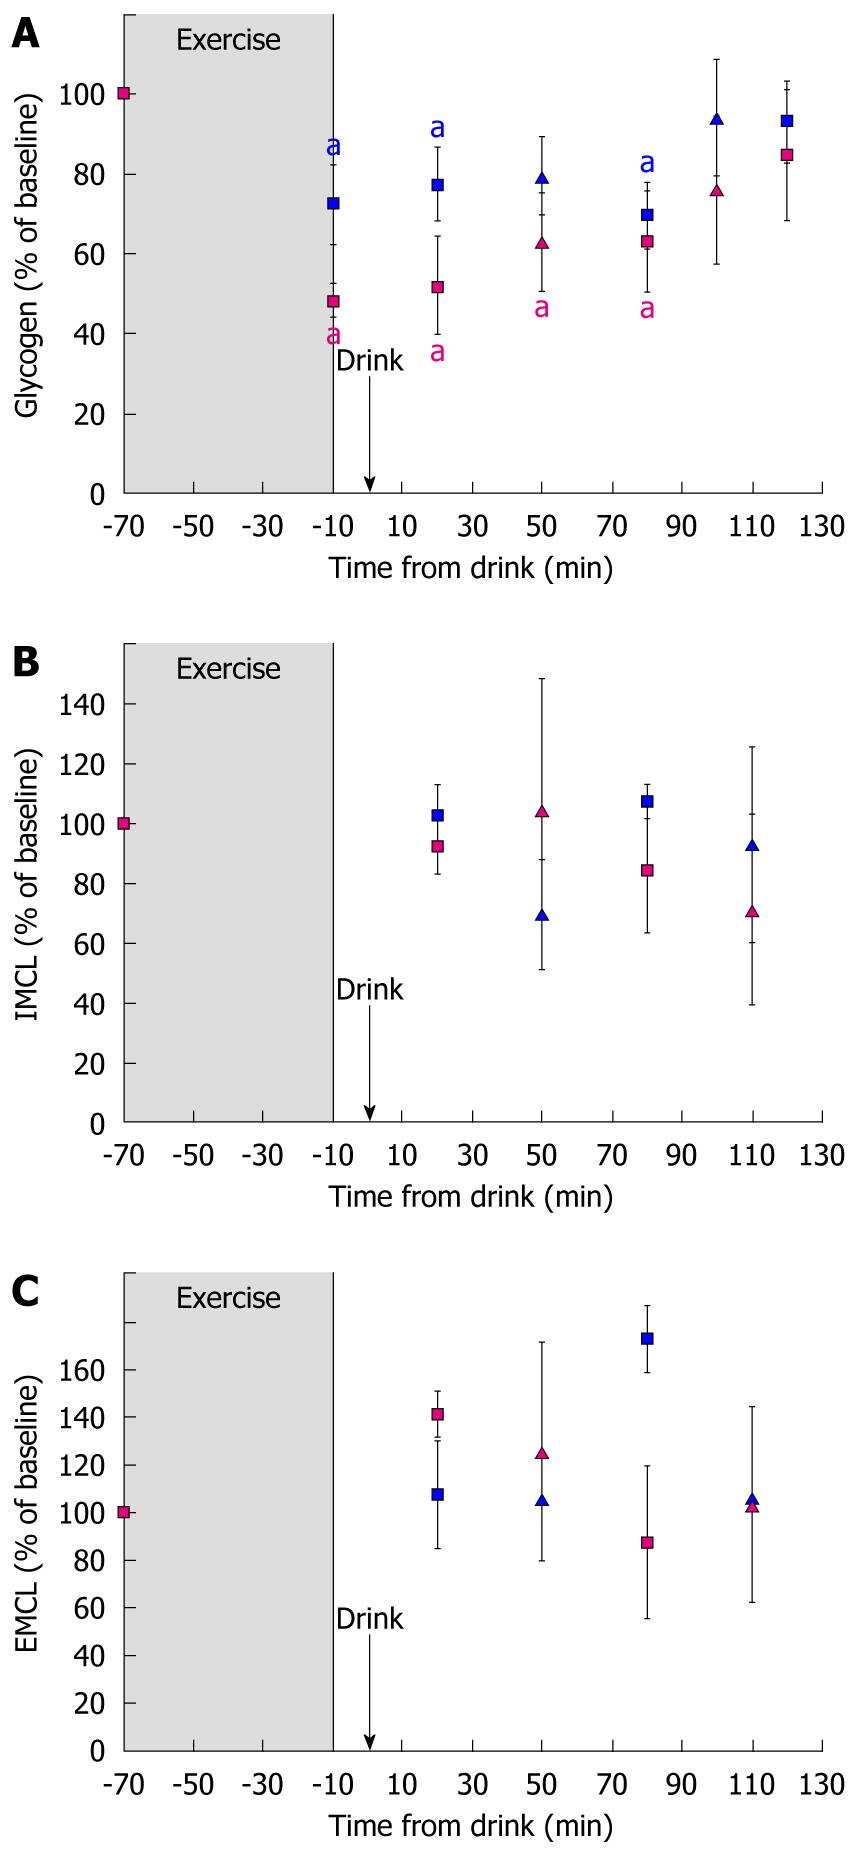
Figure 2 Percentage changes in glycogen (A), intra-myocellular lipid (B) and extra-myocellular lipid (C) levels due to exercise and following recovery.
Values are mean ± SE. Squares represent measurements in the front of thigh, triangles represent measurements in the back of thigh. Points shown in blue and pink indicate exercise at 50% and 75% VO2 max respectively (aP < 0.05). IMCL: Intra-myocellular lipid; EMCL: Extra-myocellular lipid.
- Citation: Stephenson MC, Gunner F, Napolitano A, Greenhaff PL, MacDonald IA, Saeed N, Vennart W, Francis ST, Morris PG. Applications of multi-nuclear magnetic resonance spectroscopy at 7T. World J Radiol 2011; 3(4): 105-113
- URL: https://www.wjgnet.com/1949-8470/full/v3/i4/105.htm
- DOI: https://dx.doi.org/10.4329/wjr.v3.i4.105


