Copyright
©2011 Baishideng Publishing Group Co.
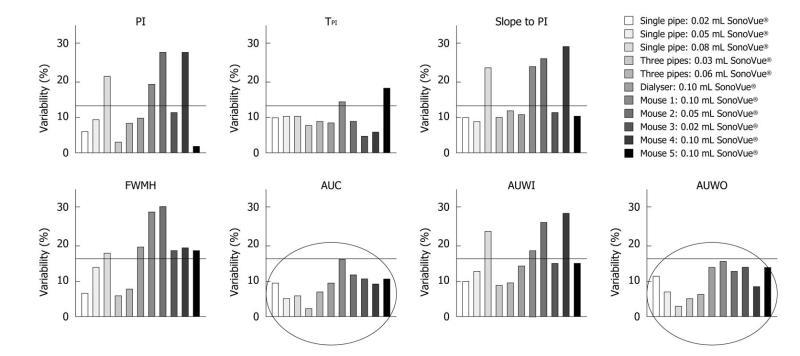
Figure 8 This graph shows the variability of perfusion parameters involved in both the in vitro and in vivo experiments.
Five injections were recorded for each of the three phantoms and three for each mouse. The results demonstrated less than 30% overall variability, whatever the perfusion parameter. CV: Coefficient of variation; PI: Peak intensity; TPI: Time to peak intensity; FWHM: Full width at half maximum; AUC: Area under the curve; AUWI: Area under the wash-in; AUWO: Area under the wash-out.
- Citation: Gauthier M, Leguerney I, Thalmensi J, Chebil M, Parisot S, Peronneau P, Roche A, Lassau N. Estimation of intra-operator variability in perfusion parameter measurements using DCE-US. World J Radiol 2011; 3(3): 70-81
- URL: https://www.wjgnet.com/1949-8470/full/v3/i3/70.htm
- DOI: https://dx.doi.org/10.4329/wjr.v3.i3.70


