Copyright
©2011 Baishideng Publishing Group Co.
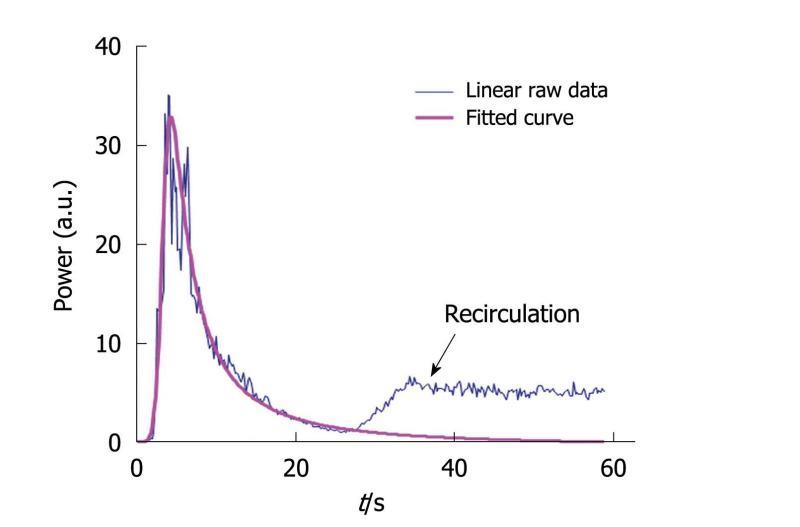
Figure 7 This graph displays both a time intensity curve and its associated fitted curve.
Recirculation is avoided through the modeling process so that the conditions required to apply the time intensity method are fulfilled: the Gustave Roussy Institute equation perfectly fits the wash-in part of the curve while the wash-out part is adjusted so that recirculation is not taken into account in the final fitted curve.
- Citation: Gauthier M, Leguerney I, Thalmensi J, Chebil M, Parisot S, Peronneau P, Roche A, Lassau N. Estimation of intra-operator variability in perfusion parameter measurements using DCE-US. World J Radiol 2011; 3(3): 70-81
- URL: https://www.wjgnet.com/1949-8470/full/v3/i3/70.htm
- DOI: https://dx.doi.org/10.4329/wjr.v3.i3.70


