Copyright
©2011 Baishideng Publishing Group Co.
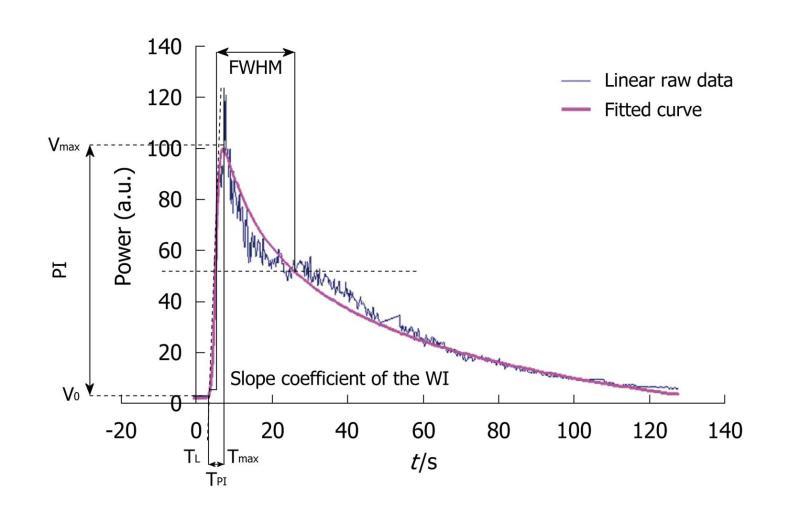
Figure 6 The graph displays an example of a time intensity curve with 4 of its 7 associated perfusion parameters: the peak intensity or peak intensity (difference between Vmax and V0), the time to peak intensity or time to peak intensity (the difference between Tmax and TL), the slope coefficient of the wash-in (the slope of the tangent of the wash-in at half maximum) and the full width at half maximum or FWHM (corresponding to a first approximation of the mean transit time).
The three other perfusion parameters extracted from the time intensity curve were the area under the curve, the area under the wash-in and the area under the wash-out. PI: Peak intensity; TPI: Time to peak intensity.
- Citation: Gauthier M, Leguerney I, Thalmensi J, Chebil M, Parisot S, Peronneau P, Roche A, Lassau N. Estimation of intra-operator variability in perfusion parameter measurements using DCE-US. World J Radiol 2011; 3(3): 70-81
- URL: https://www.wjgnet.com/1949-8470/full/v3/i3/70.htm
- DOI: https://dx.doi.org/10.4329/wjr.v3.i3.70


