Copyright
©2011 Baishideng Publishing Group Co.
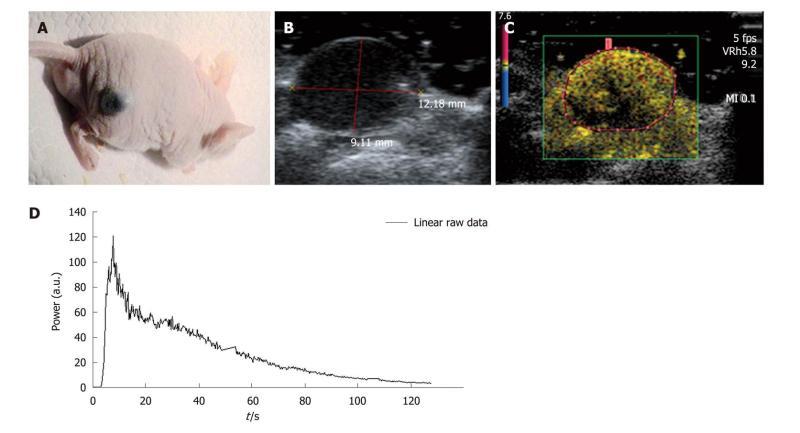
Figure 5 In vivo.
A: Experiments were conducted with nude female mice aged from 6 to 8 wk. The selected tumor model was the B16F10 melanoma cell line which is a murine skin cancer; B, C: The region of interest contained only the tumor and was drawn for each injection performed. If the image was not well defined using the harmonic mode, the B-mode image was used to correctly define the region of interest; D: As in the case of the in vitro experiments, the ultrasound scanner displayed the associated time intensity curve. This was extracted and converted through an Excel® file so that the analysis could be performed to obtain the required perfusion parameters.
- Citation: Gauthier M, Leguerney I, Thalmensi J, Chebil M, Parisot S, Peronneau P, Roche A, Lassau N. Estimation of intra-operator variability in perfusion parameter measurements using DCE-US. World J Radiol 2011; 3(3): 70-81
- URL: https://www.wjgnet.com/1949-8470/full/v3/i3/70.htm
- DOI: https://dx.doi.org/10.4329/wjr.v3.i3.70


