Copyright
©2011 Baishideng Publishing Group Co.
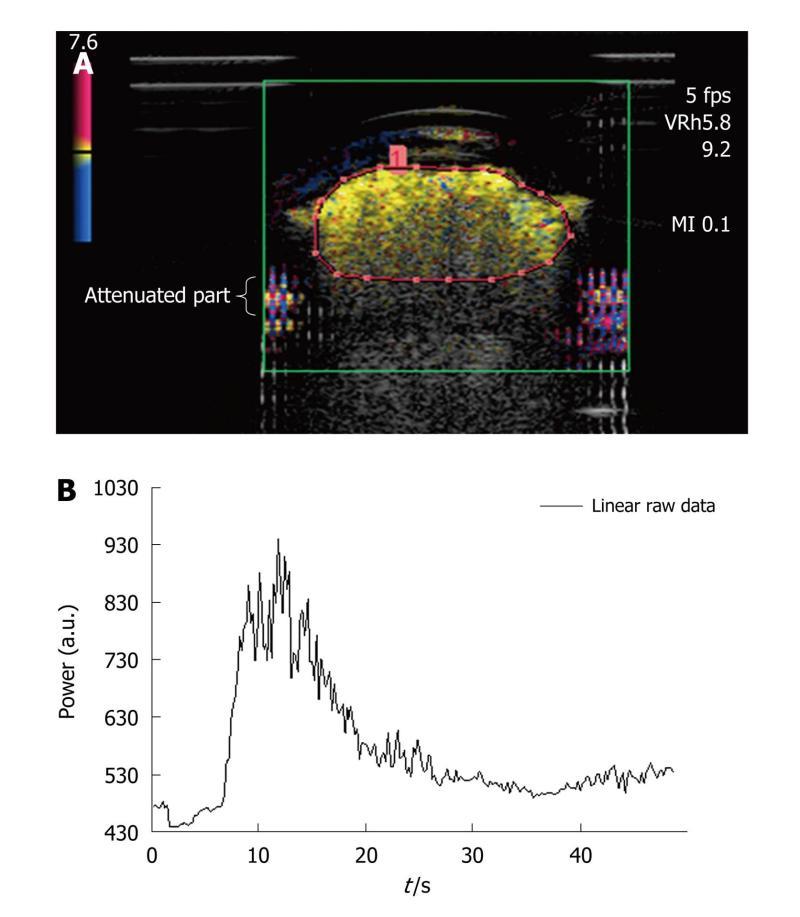
Figure 4 Dialyzer.
A: Image extracted from an acquisition obtained after a bolus injection of SonoVue®. As in the case of the first two phantoms, harmonic imaging was based on the Vascular Recognition Imaging mode. The region of interest contained the upper part of the dialyzer to avoid attenuation phenomena in the lower parts. This was manually drawn for each injection; B: To determine perfusion parameters from the time intensity curve obtained following the selection of the region of interest, this was converted through text files so that the analysis could be performed using the Solver program in Excel®.
- Citation: Gauthier M, Leguerney I, Thalmensi J, Chebil M, Parisot S, Peronneau P, Roche A, Lassau N. Estimation of intra-operator variability in perfusion parameter measurements using DCE-US. World J Radiol 2011; 3(3): 70-81
- URL: https://www.wjgnet.com/1949-8470/full/v3/i3/70.htm
- DOI: https://dx.doi.org/10.4329/wjr.v3.i3.70


