Copyright
©2011 Baishideng Publishing Group Co.
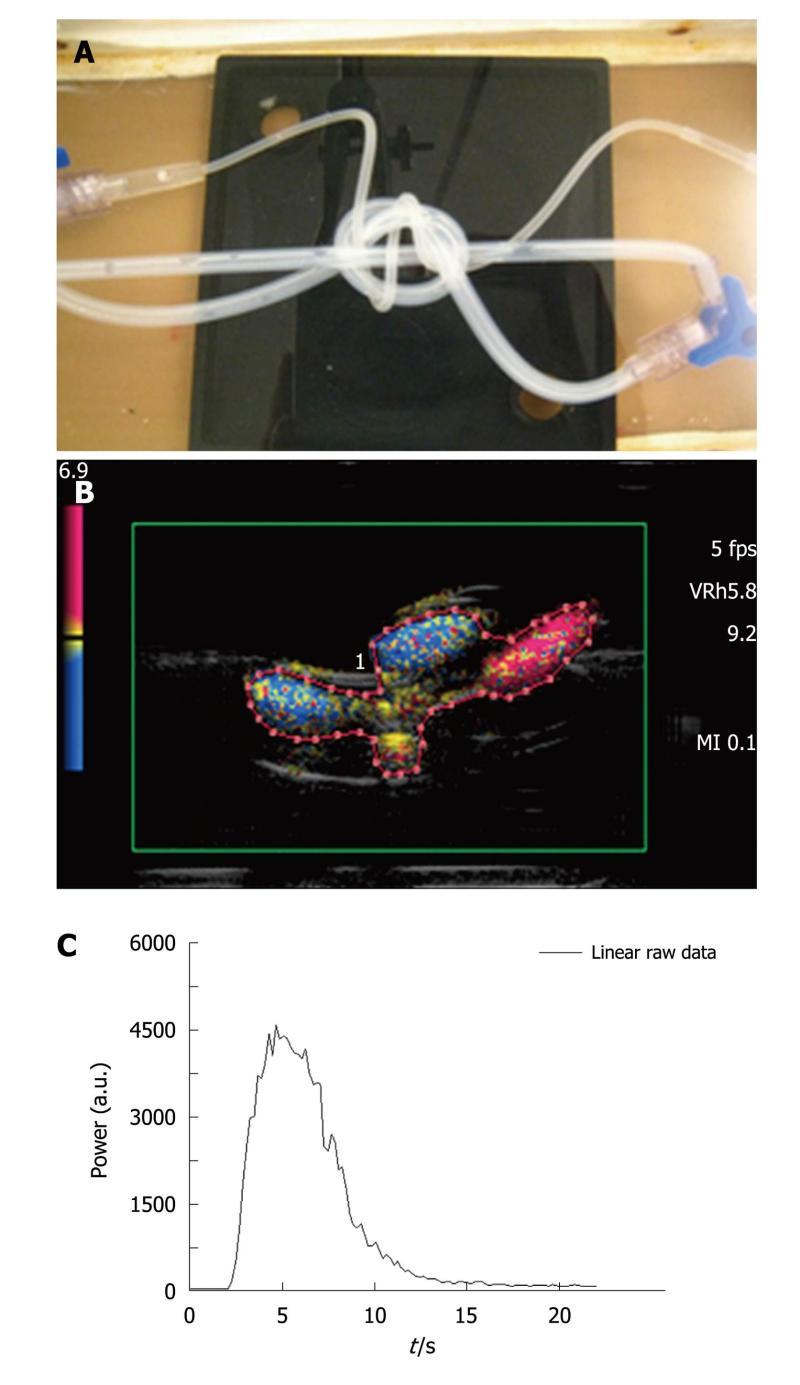
Figure 3 Three intertwined pipe phantom.
A: Picture of the phantom: three pipes (2 pipes with a 2 mm internal diameter and a 1 mm thick wall, 1 pipe with a 1 mm internal diameter and a 0.5 mm thick wall ) were intertwined to mimic a complex structure akin to that of vessels in the microvascularization; B: Image extracted from an acquisition obtained after a bolus injection of SonoVue®. As in the case of the first phantom, harmonic imaging was based on the Vascular Recognition Imaging mode. The region of interest contained both pipes and water and was manually drawn for each of the five injections; C: Based on the selected region of interest, the ultrasound scanner provided the time intensity curve converted through text files. These were used to display the associated Excel® curve to be analyzed.
- Citation: Gauthier M, Leguerney I, Thalmensi J, Chebil M, Parisot S, Peronneau P, Roche A, Lassau N. Estimation of intra-operator variability in perfusion parameter measurements using DCE-US. World J Radiol 2011; 3(3): 70-81
- URL: https://www.wjgnet.com/1949-8470/full/v3/i3/70.htm
- DOI: https://dx.doi.org/10.4329/wjr.v3.i3.70


