Copyright
©2011 Baishideng Publishing Group Co.
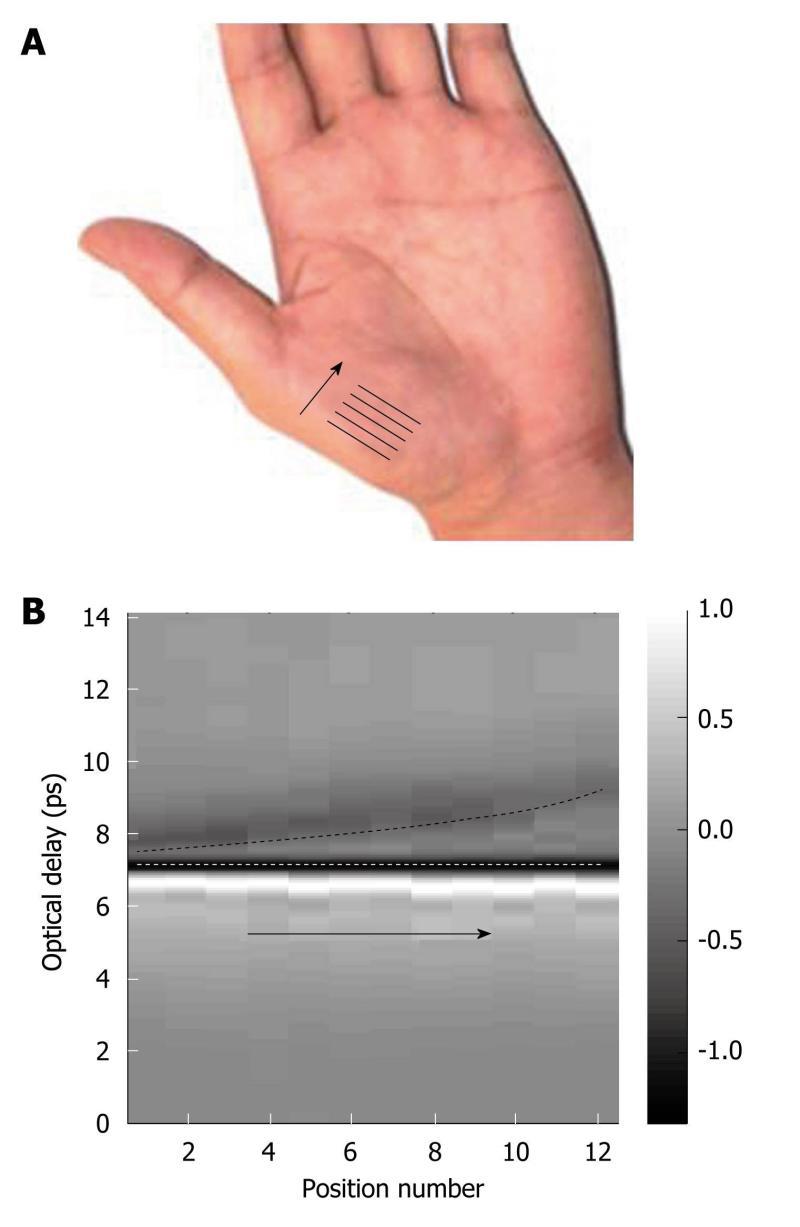
Figure 12 In vivo measurement of the variation in stratum corneum thickness of the palm.
A: Photograph of the palm, indicating where the THz measurements were taken; B: A b-scan image showing the variation in stratum corneum thickness with palm position. The white dashed line indicates the interface between the quartz window and the stratum corneum; and the black dashed line indicates the interface between the stratum corneum and the epidermis. The grey bar represents the ratio of the electric field at a given optical delay, t, over the maximum electric field [E(t)/Emax].
- Citation: Sun Y, Sy MY, Wang YXJ, Ahuja AT, Zhang YT, Pickwell-MacPherson E. A promising diagnostic method: Terahertz pulsed imaging and spectroscopy. World J Radiol 2011; 3(3): 55-65
- URL: https://www.wjgnet.com/1949-8470/full/v3/i3/55.htm
- DOI: https://dx.doi.org/10.4329/wjr.v3.i3.55


