Copyright
©2011 Baishideng Publishing Group Co.
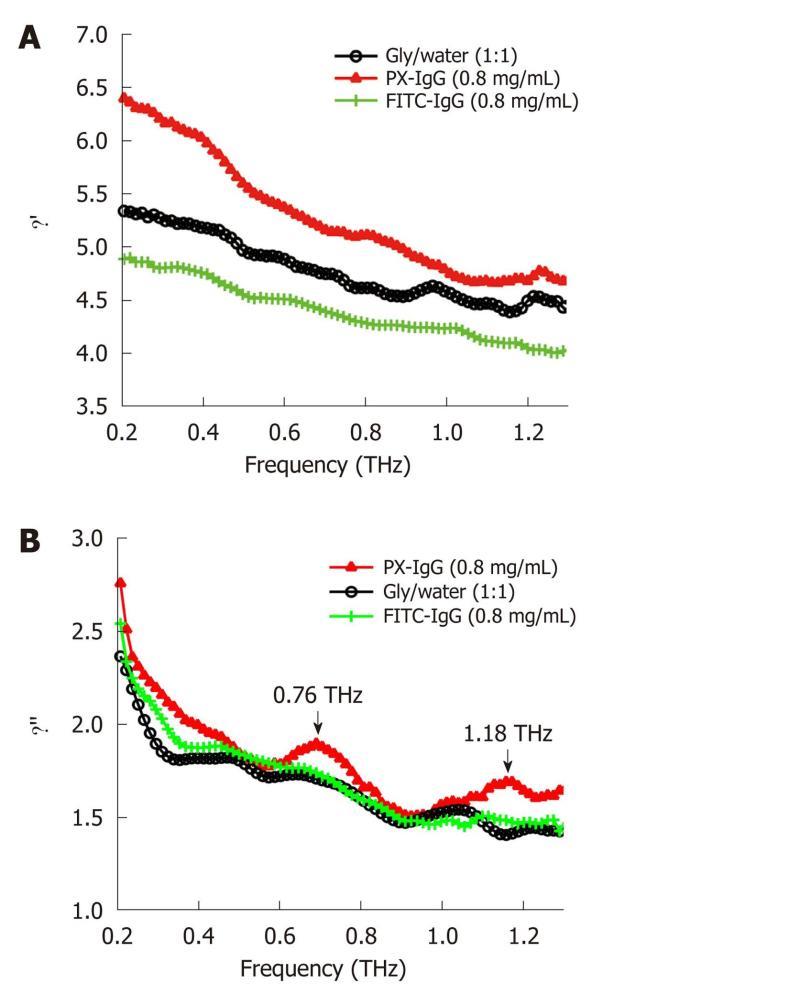
Figure 6 Dielectric constant spectra (A) and dielectric loss spectra (B) of water/ glycerol mix (black line with circles), peroxidase conjugated IgG (red line with triangles) and the fluorescein conjugated IgG (green line with crosses) dissolved in the water/glycerol solution at the concentration of 0.
8 mg/mL in the frequency range of 0.1-1.3 THz. PX: Peroxidase conjugated; FITC: Fluorescein conjugated.
- Citation: Sun Y, Sy MY, Wang YXJ, Ahuja AT, Zhang YT, Pickwell-MacPherson E. A promising diagnostic method: Terahertz pulsed imaging and spectroscopy. World J Radiol 2011; 3(3): 55-65
- URL: https://www.wjgnet.com/1949-8470/full/v3/i3/55.htm
- DOI: https://dx.doi.org/10.4329/wjr.v3.i3.55


