Copyright
©2011 Baishideng Publishing Group Co.
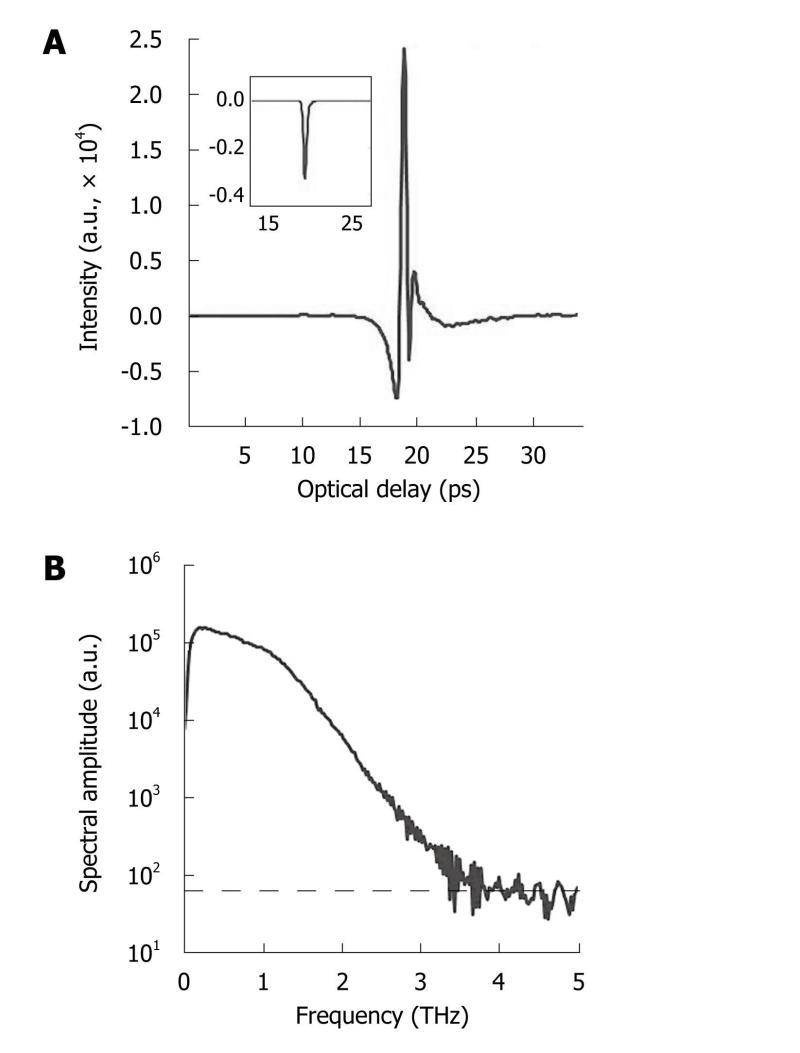
Figure 4 Typical terahertz pulse and corresponding spectrum.
A: Temporal waveform of a sample (drawn by raw data with the inset representing its corresponding processed data after deconvolution with a reference measurement); B: The corresponding spectrum of the raw data with the noise floor (indicated by dashed line).
- Citation: Sun Y, Sy MY, Wang YXJ, Ahuja AT, Zhang YT, Pickwell-MacPherson E. A promising diagnostic method: Terahertz pulsed imaging and spectroscopy. World J Radiol 2011; 3(3): 55-65
- URL: https://www.wjgnet.com/1949-8470/full/v3/i3/55.htm
- DOI: https://dx.doi.org/10.4329/wjr.v3.i3.55


