Copyright
©2011 Baishideng Publishing Group Co.
World J Radiol. Dec 28, 2011; 3(12): 298-305
Published online Dec 28, 2011. doi: 10.4329/wjr.v3.i12.298
Published online Dec 28, 2011. doi: 10.4329/wjr.v3.i12.298
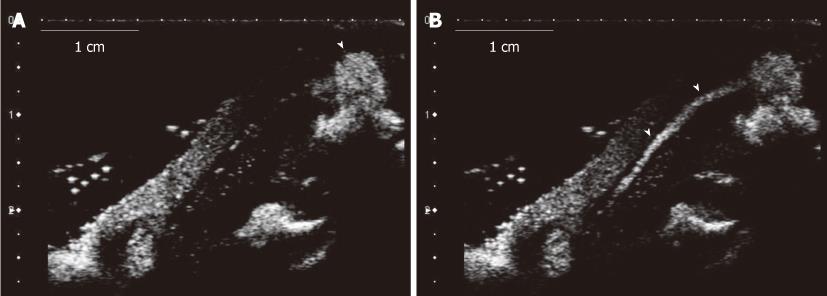
Figure 1 Ultrasound image of lymph ducts.
Model of tumor-induced lymph node enlargement at 21 d after VX2 tumor was implemented (model 3). A: Sonazoid™ that was administered subcutaneously in the tumor lesion periphery of the hind paw. The arrowhead is the site where the contrast agent was injected; B: The lymph duct (arrowheads) towards the top part from the injection site that is shown in the form of a line.
- Citation: Aoki T, Moriyasu F, Yamamoto K, Shimizu M, Yamada M, Imai Y. Image of tumor metastasis and inflammatory lymph node enlargement by contrast-enhanced ultrasonography. World J Radiol 2011; 3(12): 298-305
- URL: https://www.wjgnet.com/1949-8470/full/v3/i12/298.htm
- DOI: https://dx.doi.org/10.4329/wjr.v3.i12.298


