Copyright
©2011 Baishideng Publishing Group Co.
World J Radiol. Nov 28, 2011; 3(11): 266-272
Published online Nov 28, 2011. doi: 10.4329/wjr.v3.i11.266
Published online Nov 28, 2011. doi: 10.4329/wjr.v3.i11.266
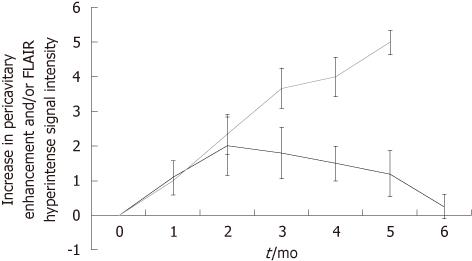
Figure 4 Graphic illustration.
Post-treatment changes and time course. This diagram illustrates a progressive increase in pericavitary enhancement and FLAIR hyperintensity that occurs within the first 2 mo of Gliadel wafer deposition. At the 2 mo mark, all patients (5/8) without recurrence demonstrated a steady decline in post-treatment changes on their magnetic resonance imaging (MRI) relative to the immediate prior examination (dark gray-black line). All (3/8) patients who had recurrence demonstrated a continued increase in enhancement and FLAIR hyperintensity relative to their immediate prior MRI study (light gray line).
- Citation: Colen RR, Zinn PO, Hazany S, Do-Dai D, Wu JK, Yao K, Zhu JJ. Magnetic resonance imaging appearance and changes on intracavitary Gliadel wafer placement: A pilot study. World J Radiol 2011; 3(11): 266-272
- URL: https://www.wjgnet.com/1949-8470/full/v3/i11/266.htm
- DOI: https://dx.doi.org/10.4329/wjr.v3.i11.266


