Copyright
©2011 Baishideng Publishing Group Co.
World J Radiol. Oct 28, 2011; 3(10): 241-245
Published online Oct 28, 2011. doi: 10.4329/wjr.v3.i10.241
Published online Oct 28, 2011. doi: 10.4329/wjr.v3.i10.241
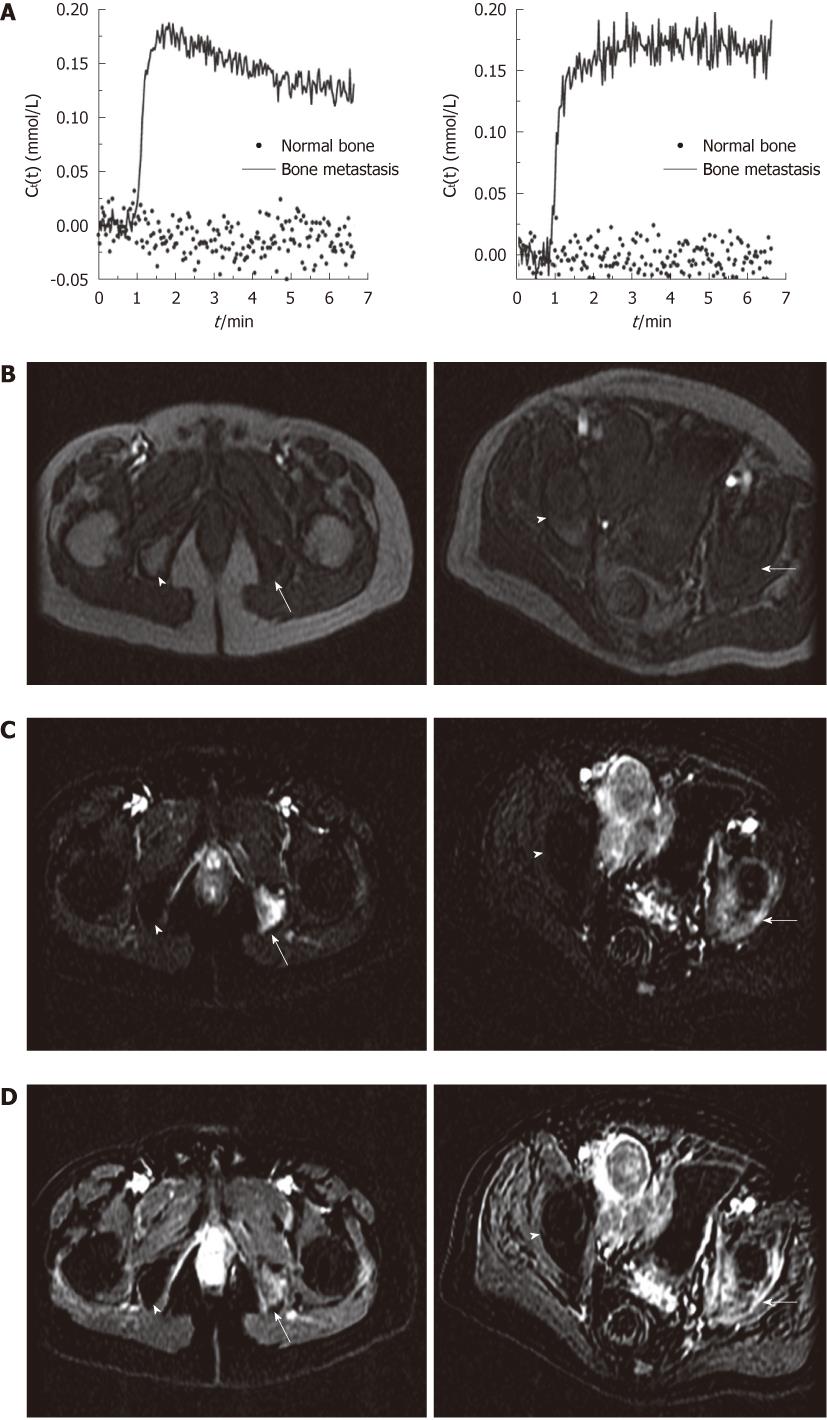
Figure 2 Pelvic bone metastasis on the left side in a patient with prostate cancer compared with normal pelvic bones on the right side.
A: Contrast agent concentration vs time curve of bone metastasis region of interest (ROI) and normal bone ROI; B: Pre-contrast image (arrow: bone metastasis, arrowhead: normal bone); C: The average subtraction image for the first minute after bolus arrival; D: The average subtraction image for the last 1 min in two representative patients (arrow:bone metastasis, arrowhead: normal bone).
- Citation: Kayhan A, Yang C, Soylu FN, Lakadamyalı H, Sethi I, Karczmar G, Stadler W, Oto A. Dynamic contrast-enhanced MR imaging findings of bone metastasis in patients with prostate cancer. World J Radiol 2011; 3(10): 241-245
- URL: https://www.wjgnet.com/1949-8470/full/v3/i10/241.htm
- DOI: https://dx.doi.org/10.4329/wjr.v3.i10.241


