Copyright
©2010 Baishideng Publishing Group Co.
World J Radiol. Jul 28, 2010; 2(7): 237-248
Published online Jul 28, 2010. doi: 10.4329/wjr.v2.i7.237
Published online Jul 28, 2010. doi: 10.4329/wjr.v2.i7.237
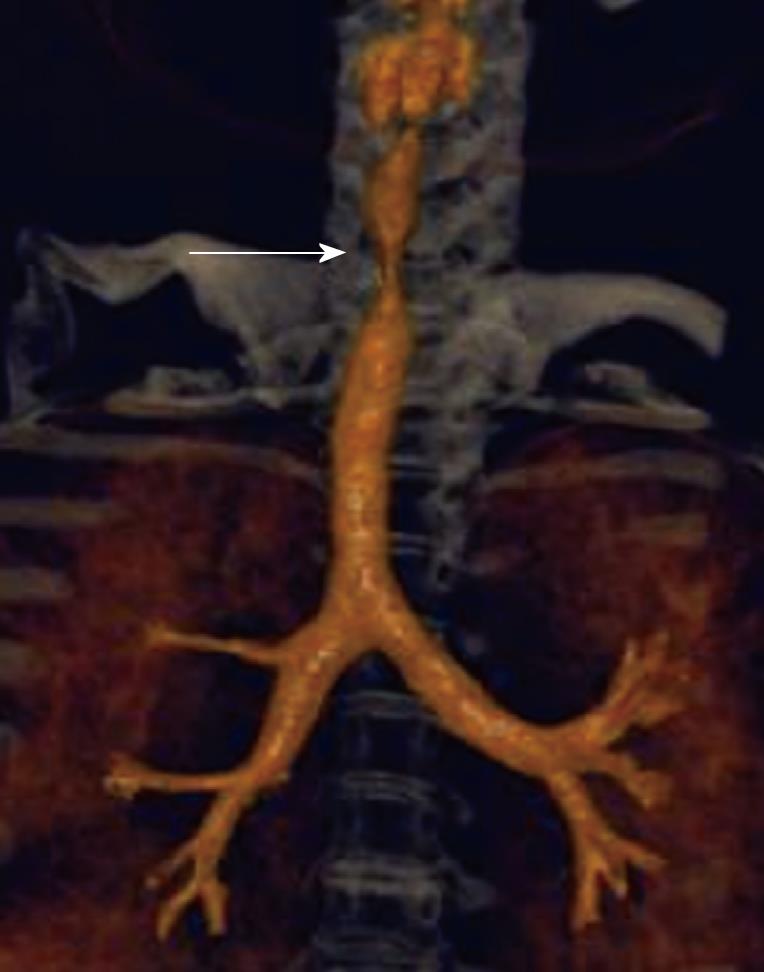
Figure 9 Subglottic stenosis.
Three-dimensional (3-D) shaded surface display computed tomography (CT) image shows smooth focal narrowing of the trachea in the subglottic region (arrow). The extent of the stenosis is much better demonstrated on the 3-D images than on axial CT images.
- Citation: Laroia AT, Thompson BH, Laroia ST, Beek EJV. Modern imaging of the tracheo-bronchial tree. World J Radiol 2010; 2(7): 237-248
- URL: https://www.wjgnet.com/1949-8470/full/v2/i7/237.htm
- DOI: https://dx.doi.org/10.4329/wjr.v2.i7.237


