Copyright
©2010 Baishideng Publishing Group Co.
World J Radiol. Apr 28, 2010; 2(4): 113-121
Published online Apr 28, 2010. doi: 10.4329/wjr.v2.i4.113
Published online Apr 28, 2010. doi: 10.4329/wjr.v2.i4.113
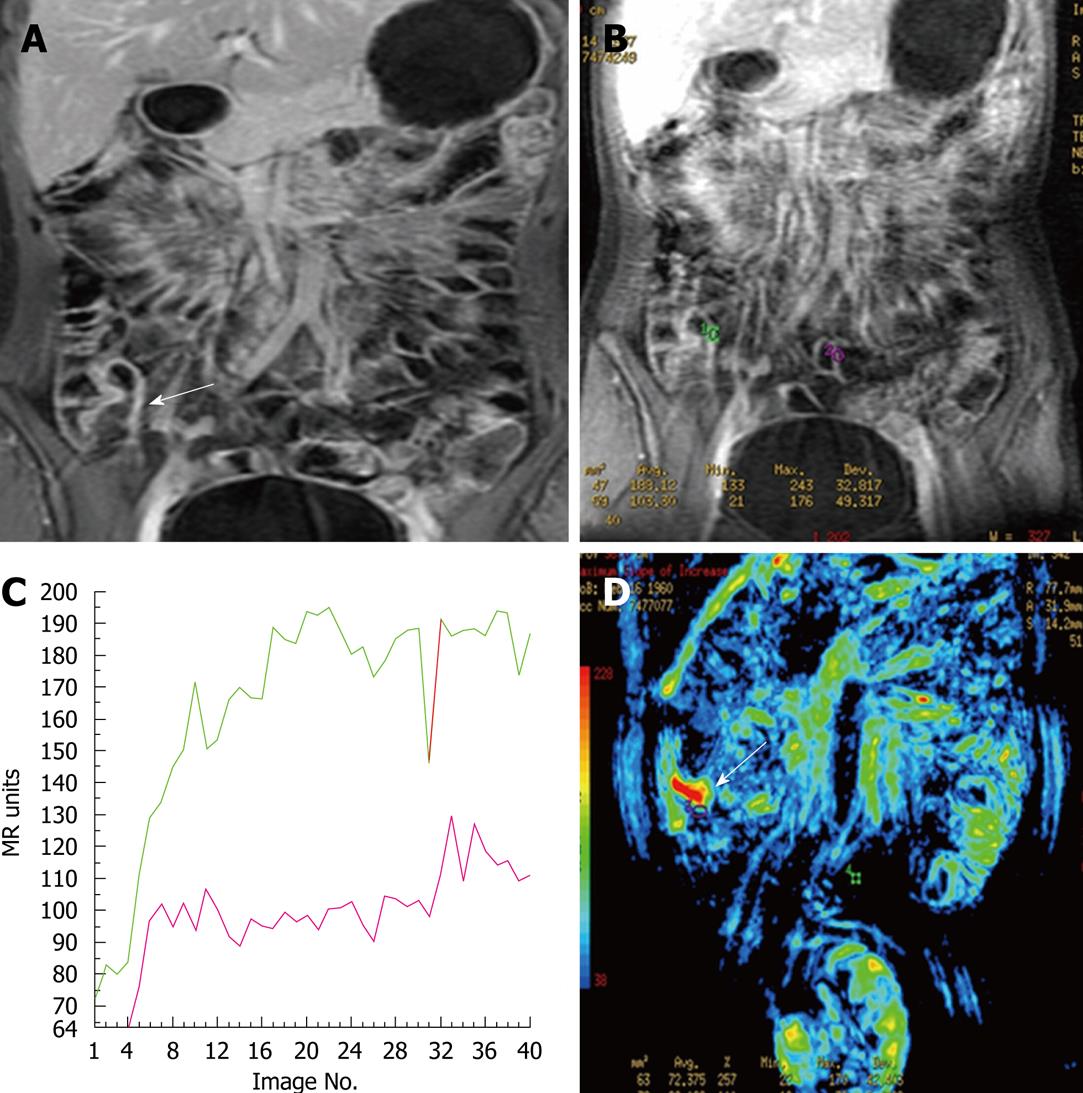
Figure 4 Dynamic-contrast enhanced magnetic resonance imaging (DCE-MRI) findings in inflamed terminal ileum and in a normal segment.
A: Coronal contrast-enhanced 3D GRE T1-weighted image shows wall thickening and increased enhancement of TI wall (arrow); B: Dynamic contrast-enhanced image showing ROI placed on inflamed terminal ileum (green ROI) wall and normal ileal segment (purple ROI); C: The time-intensity curves plotted as a function of time for terminal ileum and normal ileal segment. Perfusion parameters of TI (green curve) is higher than the normal ileal segments (purple curve); D: Color map generated from dynamic contrast enhanced study shows increased perfusion in terminal ileum (arrow).
- Citation: Kayhan A, Oommen J, Dahi F, Oto A. Magnetic resonance enterography in Crohn’s disease: Standard and advanced techniques. World J Radiol 2010; 2(4): 113-121
- URL: https://www.wjgnet.com/1949-8470/full/v2/i4/113.htm
- DOI: https://dx.doi.org/10.4329/wjr.v2.i4.113


