Copyright
©2010 Baishideng.
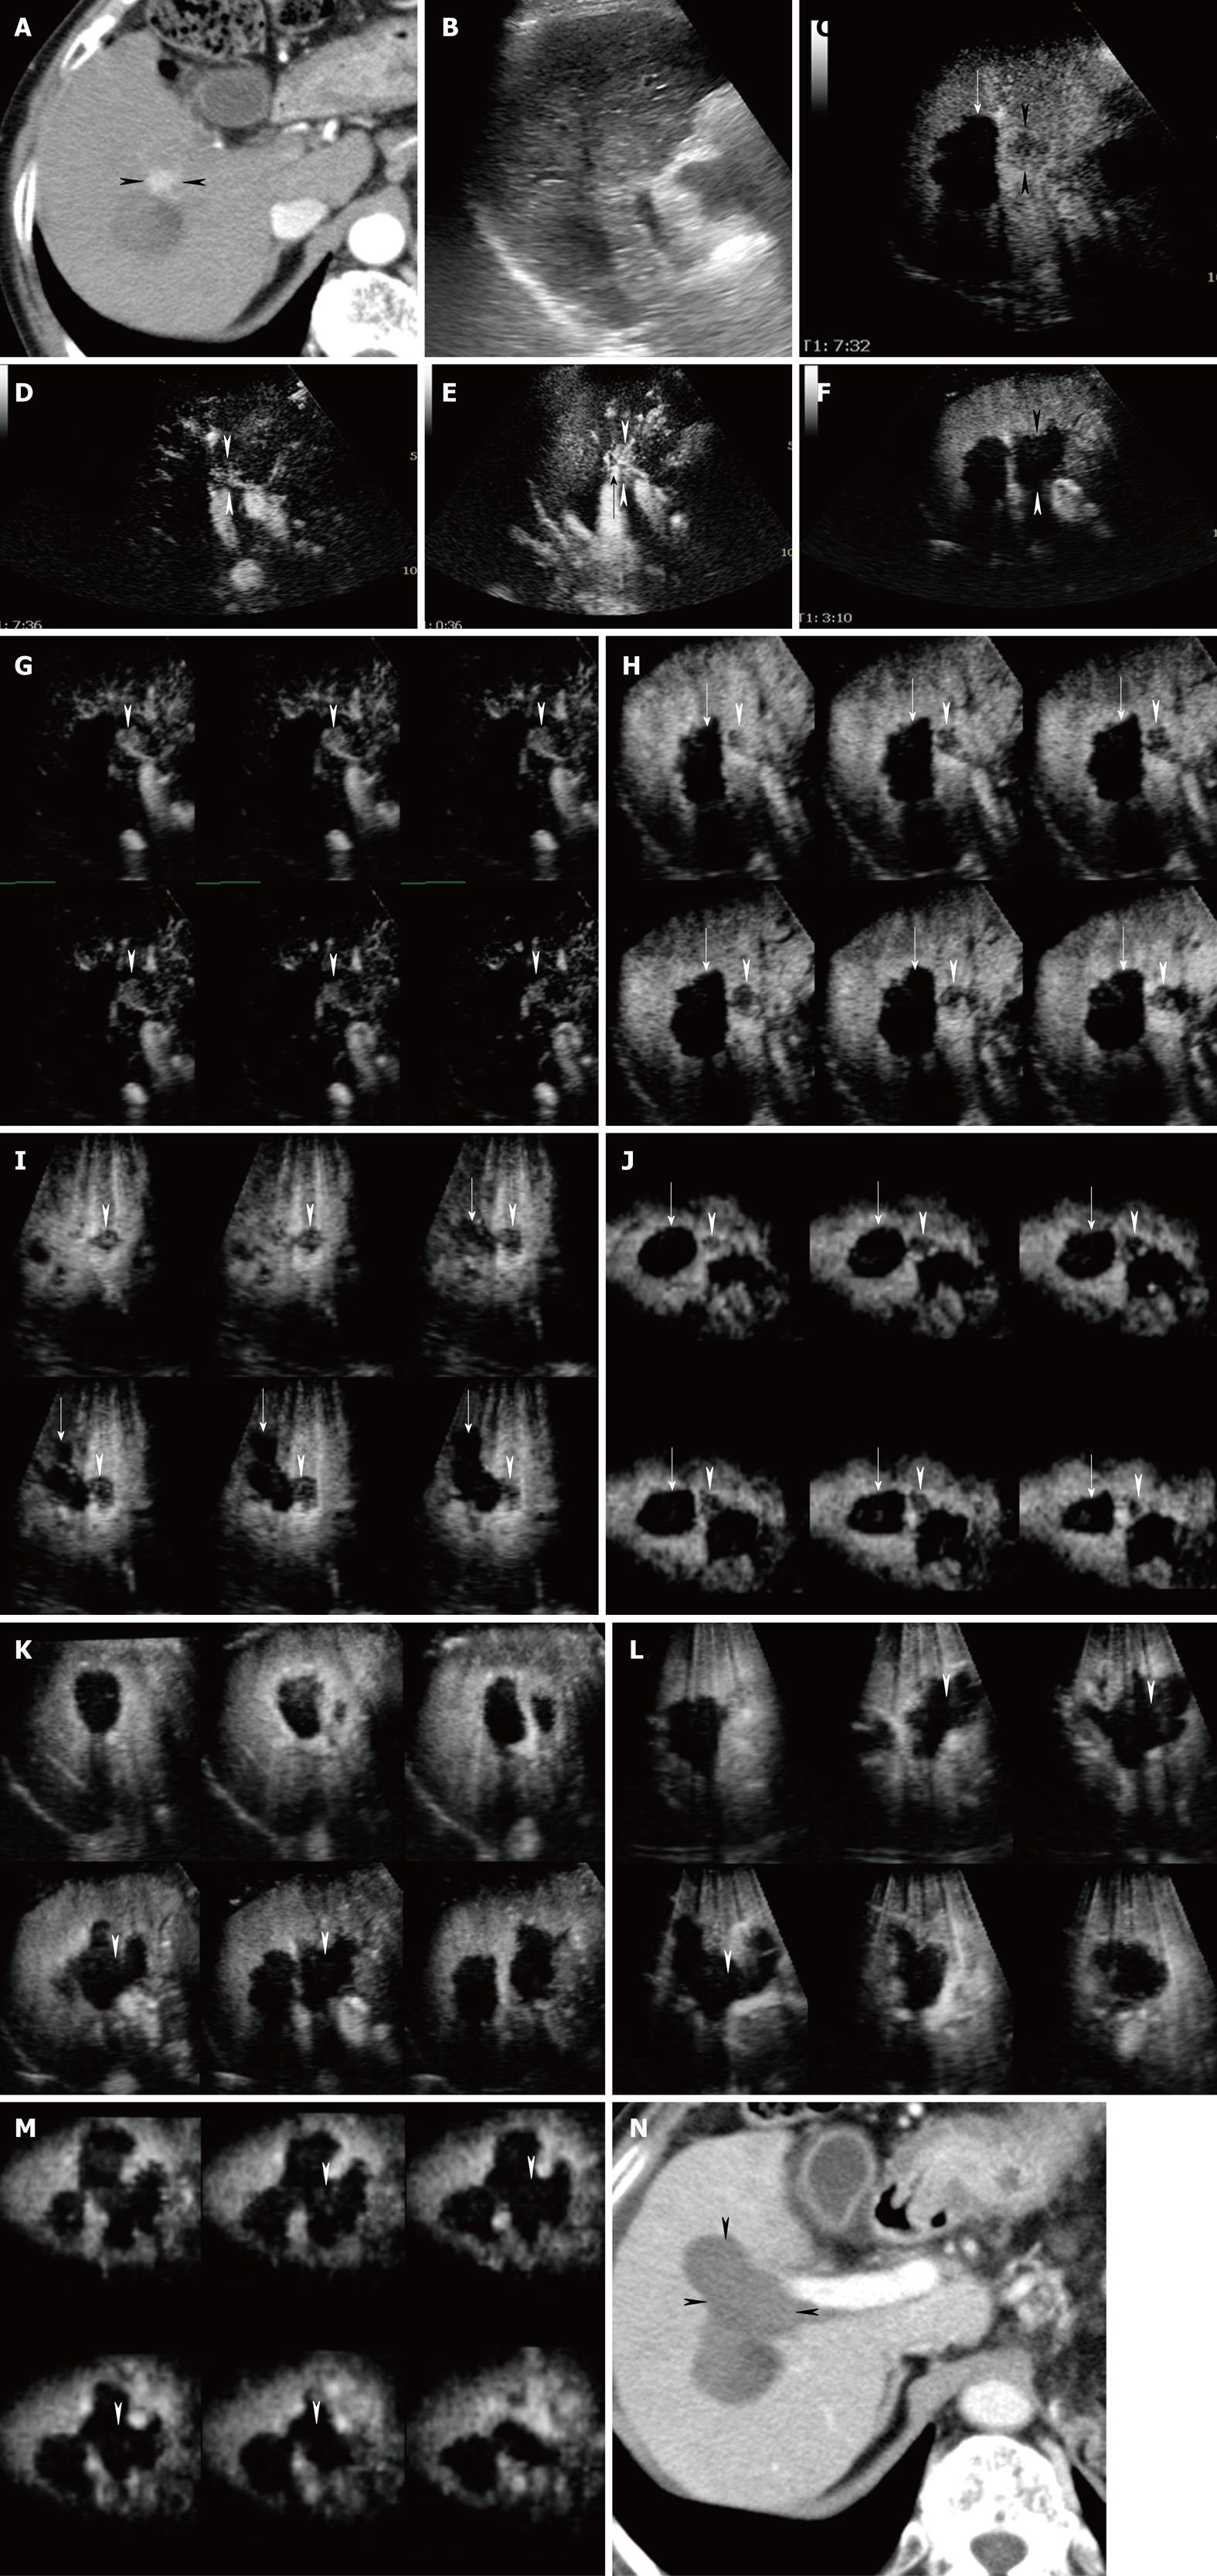
Figure 6 A 75-year-old woman with newly developed HCC (maximum diameter 15 mm) in segment VIII.
A: Arterial phase contrast-enhanced CT shows a high attenuation area in segment VIII (arrowheads); B: Conventional sonogram cannot pinpoint the location of a tumor; C: Late phase Sonazoid-enhanced US by CHA mode on a high MI intermittent image shows a perfusion defect (arrowheads). Intratumoral vessels are faintly visible. Note the non-enhanced area caused by previous percutaneous RFA therapy (arrow); D: Late phase Sonazoid-enhanced US by CHA mode at a high MI intermittent image shows intratumoral vessels (arrowheads); E: Early phase Sonazoid-enhanced US CHA mode on a high MI shows homogeneous tumor enhancement (arrowheads) and the tip of the RFA electrode (arrow) in the tumor; F: Middle phase Sonazoid-enhanced US obtained 1 d after RFA guided by early phase Sonazoid-enhanced US shows the tumor as a perfusion defect with an oval shape and distinct margins (arrowheads). This non-enhanced area is larger than the area of tumor enhancement seen in C or D. Normal liver parenchyma is enhanced; G-J: Sonazoid-enhanced 3D US images show that before RFA the HCC lesion located adjacent to the right anterior portal vein is distinctly enhanced in the early phase (arrowheads), as shown on tomographic ultrasound images in plane A, which can be translated from front to back (G). Late phase Sonazoid-enhanced 3D US images show that the HCC lesion and areas previously treated by RFA appear as perfusion defects (arrowheads) and completely non-enhanced areas (arrows), respectively, as shown on tomographic ultrasound images in plane A, which can be translated from front to back (H), plane B, which can be translated from right to left (I), and plane C, which can be translated from down to up (J); K-M: One day after RFA treatment, adequate ablation in the absence of enhancement was detected as shown in the middle phase on the tomographic ultrasound images in plane A, which can be translated from front to back (K), plane B, which can be translated from right to left (L), and plane C, which can be translated from down to up (M). Arrowheads indicate the HCC lesion margin, as seen in G or H-J. This non-enhanced area is larger than the areas seen in G or H-J. Normal liver parenchyma is enhanced; N: Arterial phase contrast-enhanced CT obtained 4 wk after treatment shows a low attenuation area (arrowhead). This low attenuation is larger than the area of high attenuation seen in A.
- Citation: Numata K, Luo W, Morimoto M, Kondo M, Kunishi Y, Sasaki T, Nozaki A, Tanaka K. Contrast enhanced ultrasound of hepatocellular carcinoma. World J Radiol 2010; 2(2): 68-82
- URL: https://www.wjgnet.com/1949-8470/full/v2/i2/68.htm
- DOI: https://dx.doi.org/10.4329/wjr.v2.i2.68


