Copyright
©2010 Baishideng.
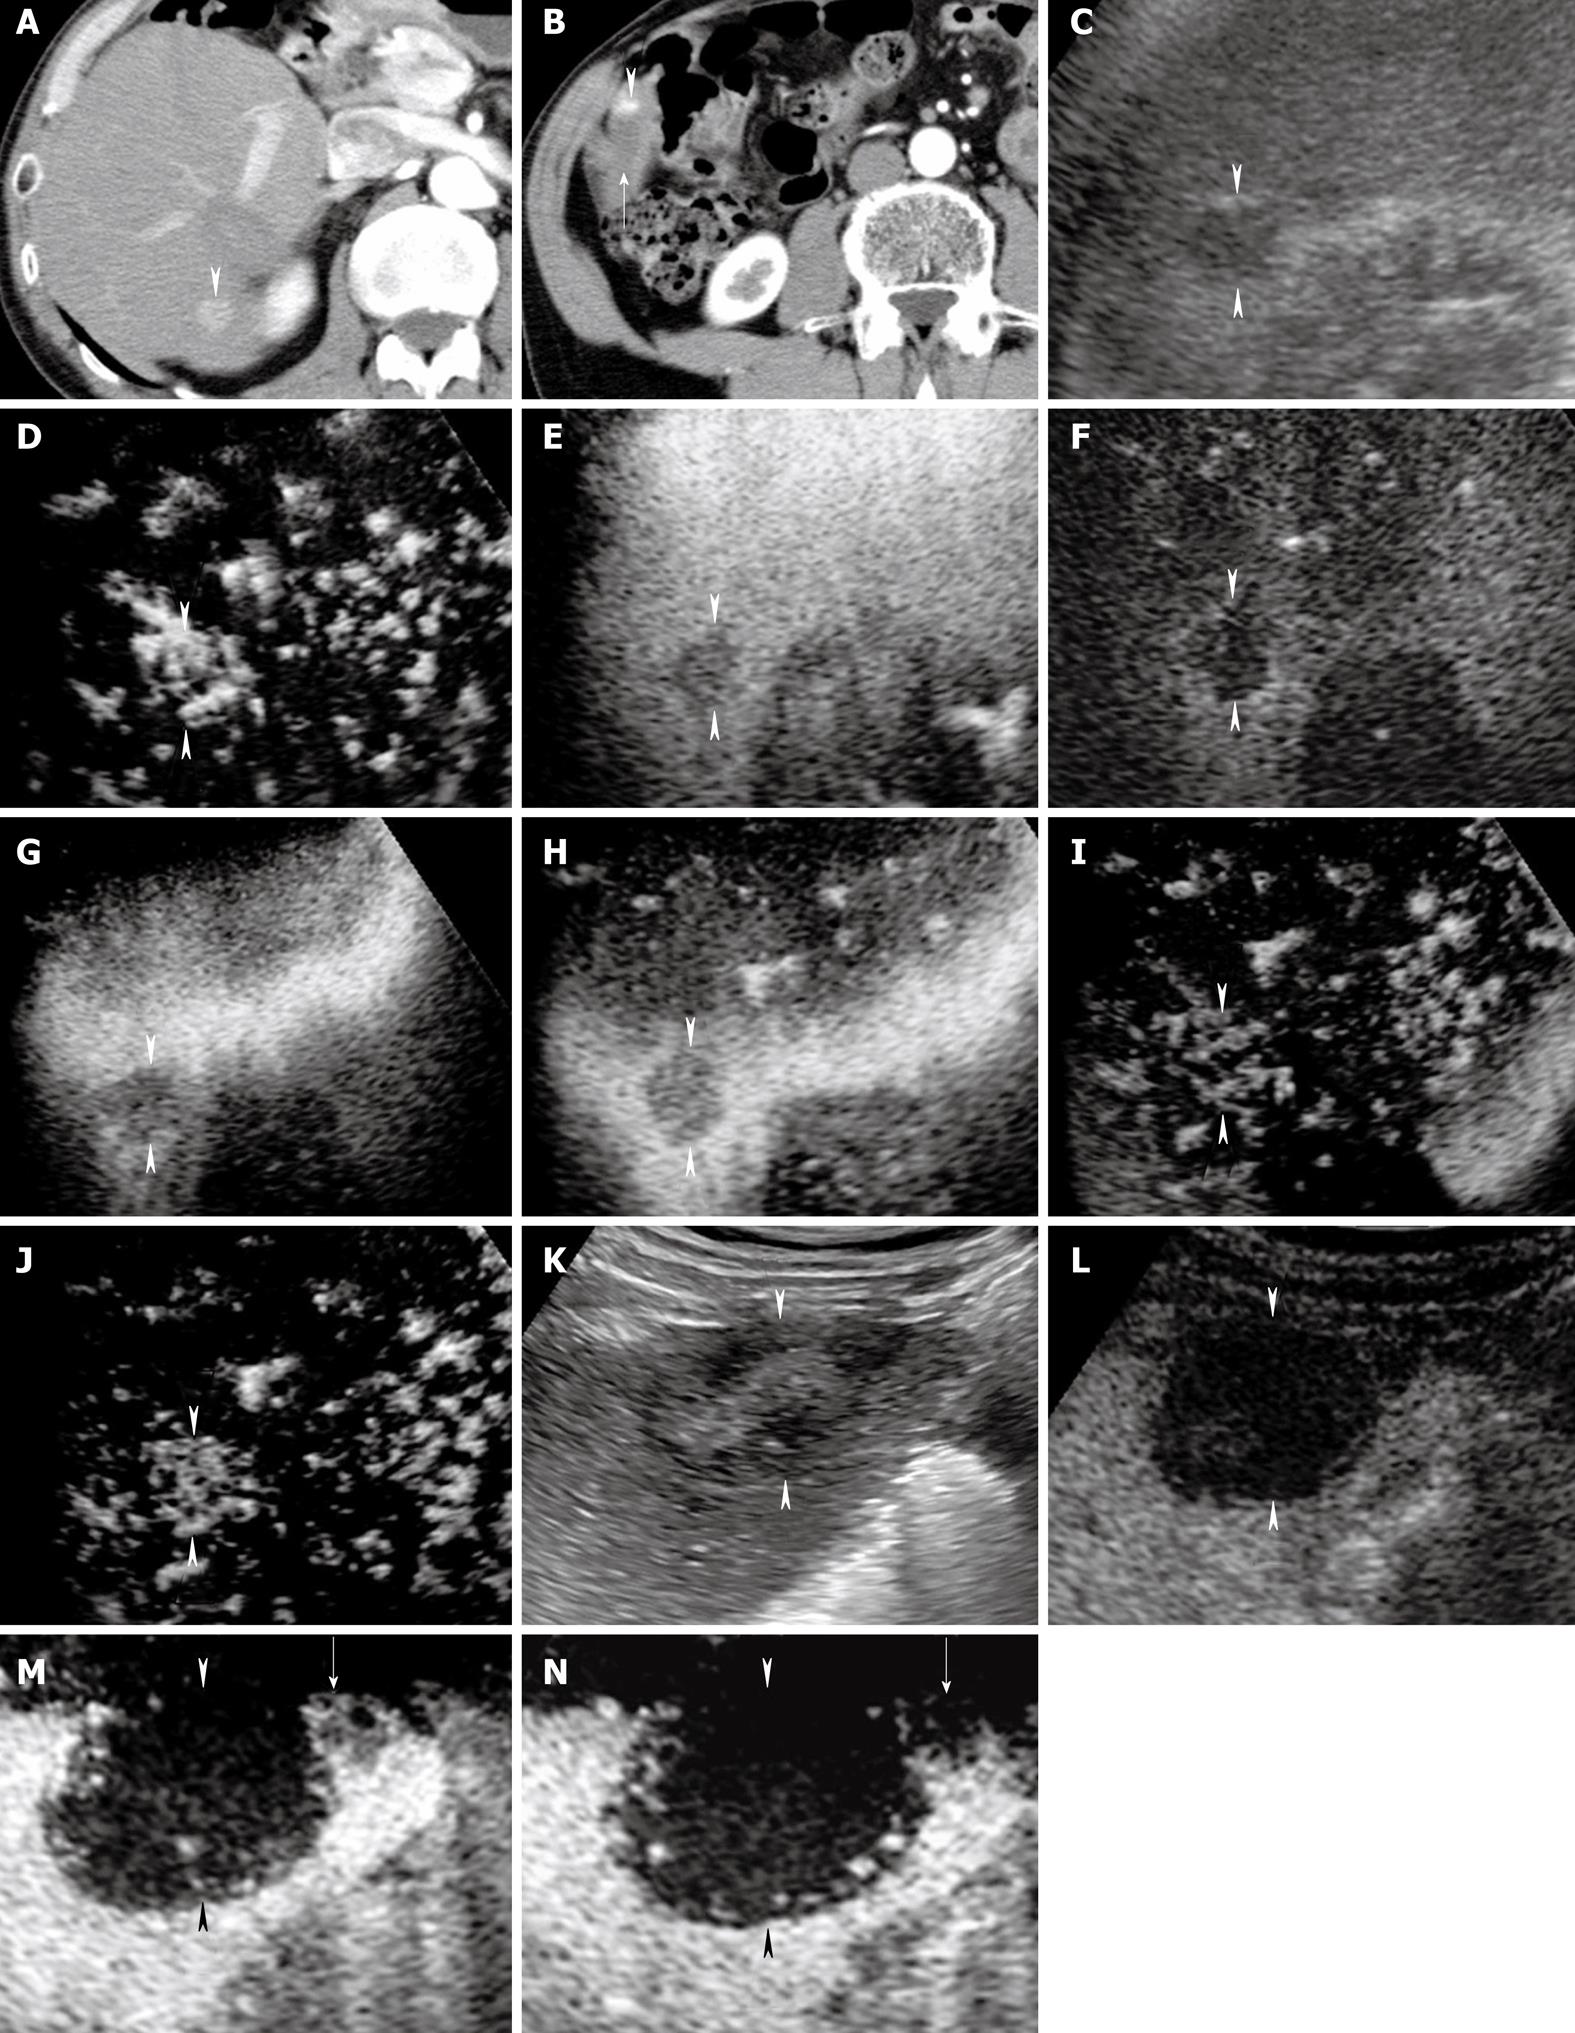
Figure 4 A 70-year-old man with newly developed HCC (maximum diameter 15 mm) in segment VI and residual viable lesion in segment V (maximum diameter 8 mm).
A-B: Arterial phase contrast-enhanced CT shows a high attenuation area in segment VI (arrowhead) (A) and a high attenuation area (arrowhead) adjacent to the non-enhanced area (arrow) in segment V (B); C: Conventional US shows a hypo-echoic tumor in segment VI (arrowheads); D: Early phase Sonazoid-enhanced US by CHA mode at a high MI shows intratumoral vessels and homogeneous tumor enhancement (arrowheads); E: Middle phase Sonazoid-enhanced US by CHA mode at a high MI shows slightly hypo-echoic (wash out) but homogeneous tumor enhancement (arrowheads); F: Late phase Sonazoid-enhanced US by CPI mode at a low MI shows a perfusion defect (wash out) (arrowheads); G-J: Late phase Sonazoid-enhanced US by CHA mode on a high MI intermittent image shows a perfusion defect (G, H) (arrowheads). Intratumoral vessels (I) and homogeneous enhancement (J) are then seen later (arrowheads); K: Conventional US shows a hypo-echoic tumor in segment V (arrowheads); L: Late phase Sonazoid-enhanced US by CPI mode at a low MI shows a perfusion defect (arrowheads). It is difficult to differentiate between the necrotic and viable areas because both appear as a perfusion defect. The normal liver parenchyma is enhanced; M-N: Late phase Sonazoid-enhanced US by CHA mode at a high MI shows intratumoral vessels in the right side of the lesion (viable area) (arrow) and no enhancement in the left side of the lesion (necrotic area). Arrowheads indicate the margin of the lesion. This enhanced area corresponds closely to the area of high attenuation seen in B.
- Citation: Numata K, Luo W, Morimoto M, Kondo M, Kunishi Y, Sasaki T, Nozaki A, Tanaka K. Contrast enhanced ultrasound of hepatocellular carcinoma. World J Radiol 2010; 2(2): 68-82
- URL: https://www.wjgnet.com/1949-8470/full/v2/i2/68.htm
- DOI: https://dx.doi.org/10.4329/wjr.v2.i2.68


