Copyright
©2010 Baishideng Publishing Group Co.
World J Radiol. Oct 28, 2010; 2(10): 384-398
Published online Oct 28, 2010. doi: 10.4329/wjr.v2.i10.384
Published online Oct 28, 2010. doi: 10.4329/wjr.v2.i10.384
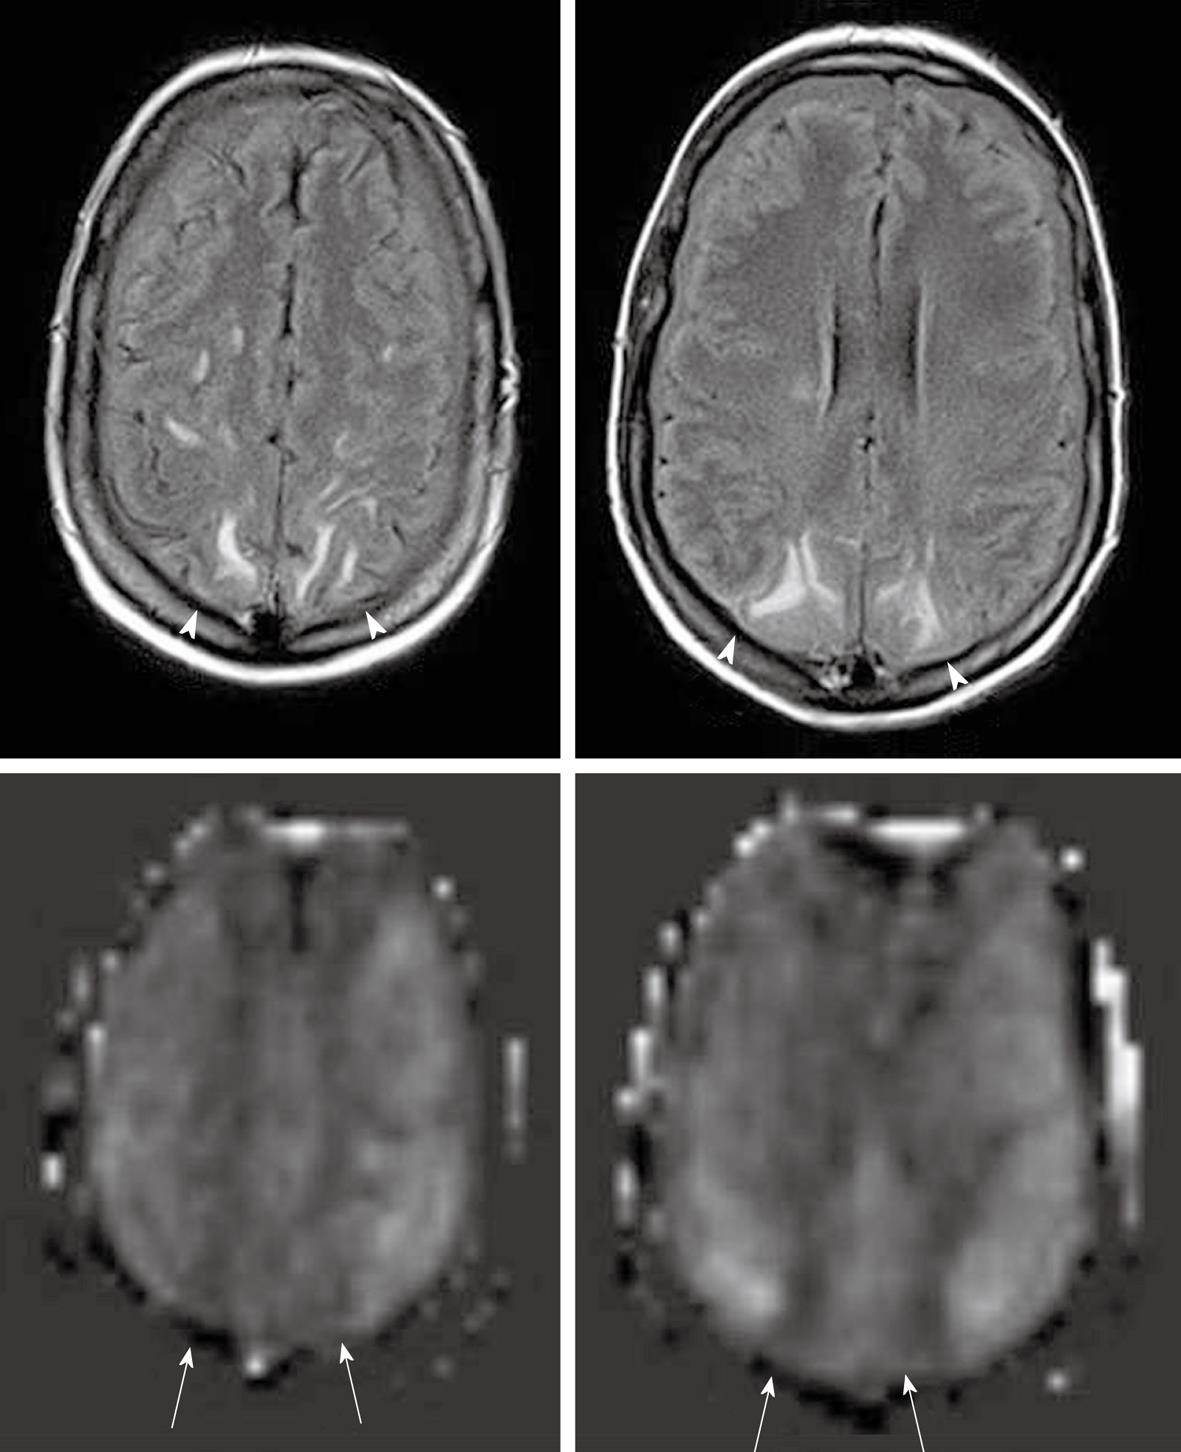
Figure 13 Posterior reversible encephalopathy syndrome seen as high signal intensity in parasagittal subcortical white matter in bilateral parietal lobes on FLAIR images (top row) (white arrowheads).
Arterial spin labeling cerebral blood flow maps (bottom row) demonstrate decreased perfusion in the affected area (white arrows). Minimal bilateral subdural fluid is also noted.
- Citation: Petcharunpaisan S, Ramalho J, Castillo M. Arterial spin labeling in neuroimaging. World J Radiol 2010; 2(10): 384-398
- URL: https://www.wjgnet.com/1949-8470/full/v2/i10/384.htm
- DOI: https://dx.doi.org/10.4329/wjr.v2.i10.384


