Copyright
©2010 Baishideng Publishing Group Co.
World J Radiol. Oct 28, 2010; 2(10): 384-398
Published online Oct 28, 2010. doi: 10.4329/wjr.v2.i10.384
Published online Oct 28, 2010. doi: 10.4329/wjr.v2.i10.384
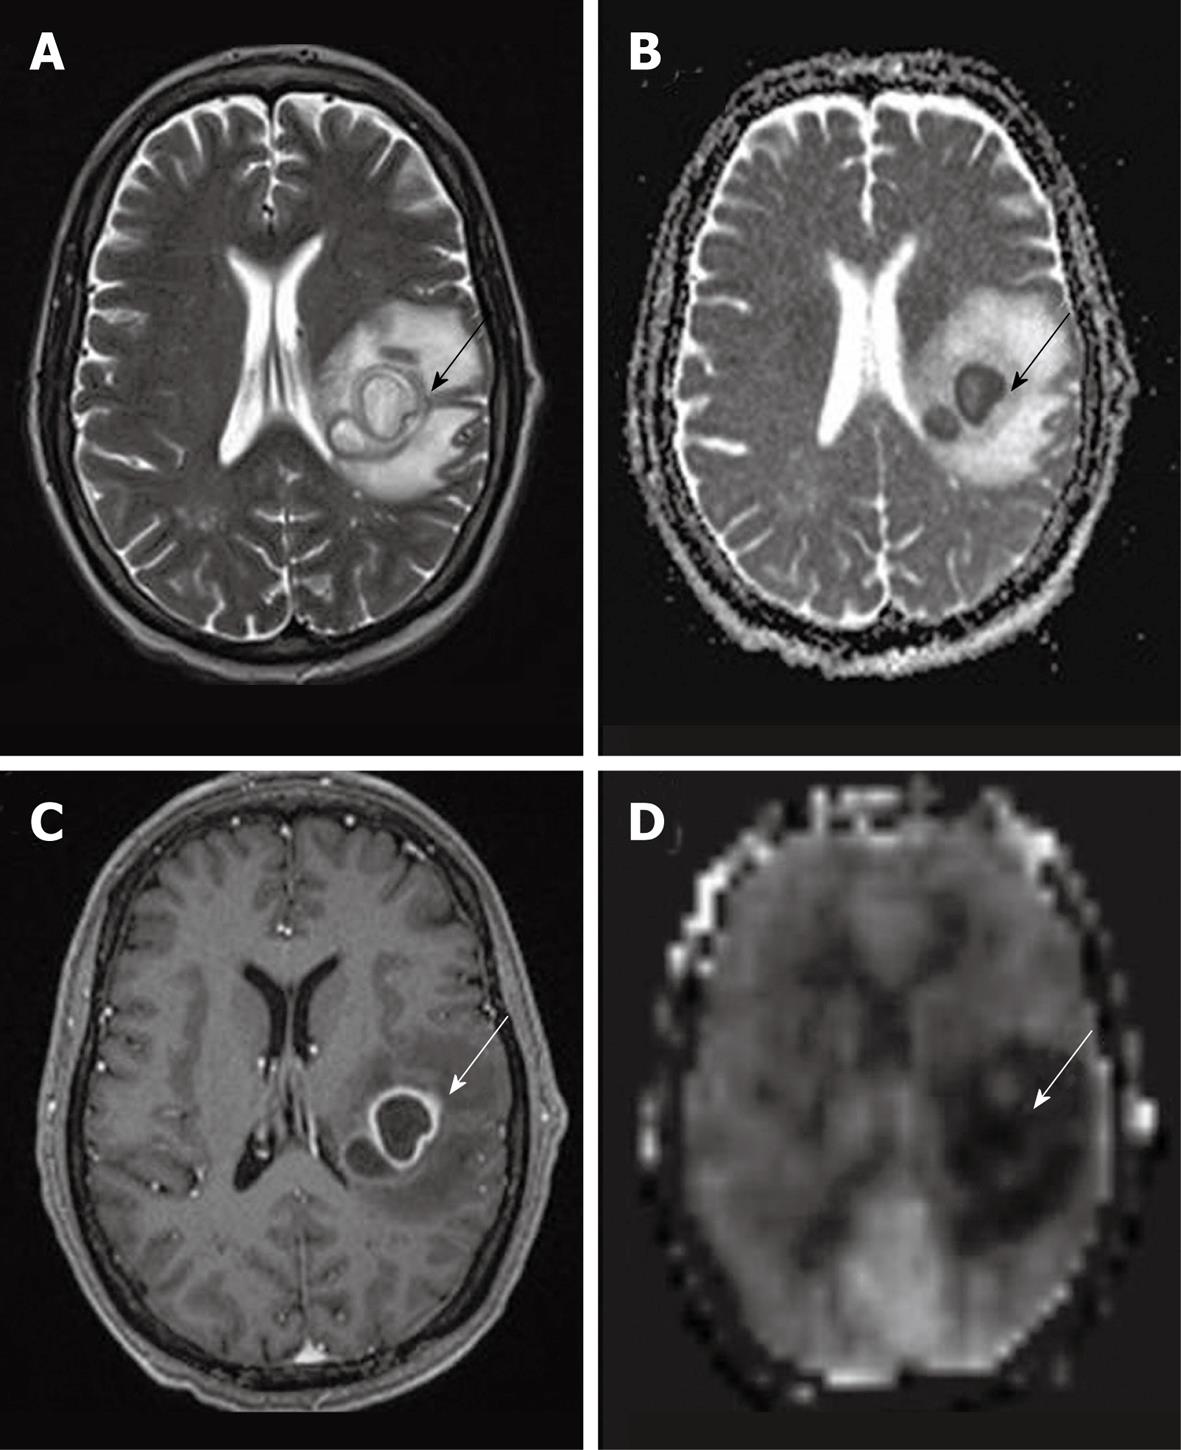
Figure 12 A case of abscess in the left frontoparietal lobe.
T2WI (A) shows internal high signal intensity with peripheral dark signal intensity (black arrow). ADC map (B) shows low signal intensity of the abscess content, representing restricted fluid diffusion (black arrow). Smooth rim enhancement is noted on post gadolinium T1WI (C) (white arrow). An arterial spin labeling cerebral blood flow map (D) shows hypoperfusion with minimal hyperperfused rim (white arrow).
- Citation: Petcharunpaisan S, Ramalho J, Castillo M. Arterial spin labeling in neuroimaging. World J Radiol 2010; 2(10): 384-398
- URL: https://www.wjgnet.com/1949-8470/full/v2/i10/384.htm
- DOI: https://dx.doi.org/10.4329/wjr.v2.i10.384


