Copyright
©2010 Baishideng Publishing Group Co.
World J Radiol. Oct 28, 2010; 2(10): 384-398
Published online Oct 28, 2010. doi: 10.4329/wjr.v2.i10.384
Published online Oct 28, 2010. doi: 10.4329/wjr.v2.i10.384
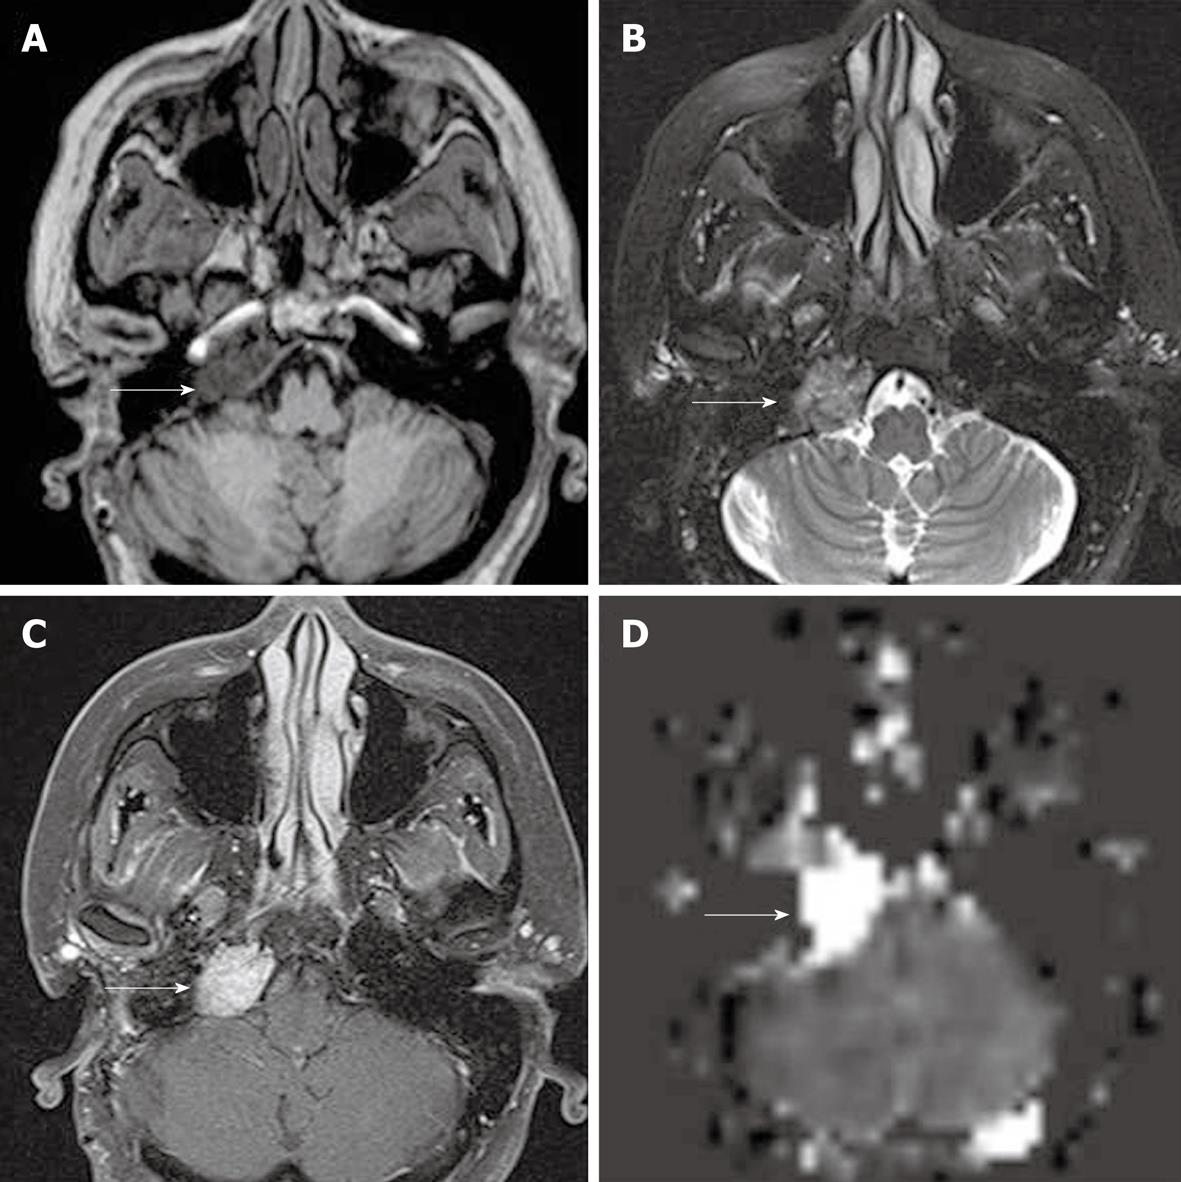
Figure 9 Residual glomus tumor in right jugular foramen, seen as low signal intensity on T1W (A), heterogeneous iso- to high signal intensity on T2WI (B), homogeneously enhancement on post gadolinium T1WI with fat suppression (C) and markedly increased perfusion on arterial spin labeling cerebral blood flow map (D) (white arrows).
- Citation: Petcharunpaisan S, Ramalho J, Castillo M. Arterial spin labeling in neuroimaging. World J Radiol 2010; 2(10): 384-398
- URL: https://www.wjgnet.com/1949-8470/full/v2/i10/384.htm
- DOI: https://dx.doi.org/10.4329/wjr.v2.i10.384


