Copyright
©2010 Baishideng Publishing Group Co.
World J Radiol. Oct 28, 2010; 2(10): 384-398
Published online Oct 28, 2010. doi: 10.4329/wjr.v2.i10.384
Published online Oct 28, 2010. doi: 10.4329/wjr.v2.i10.384
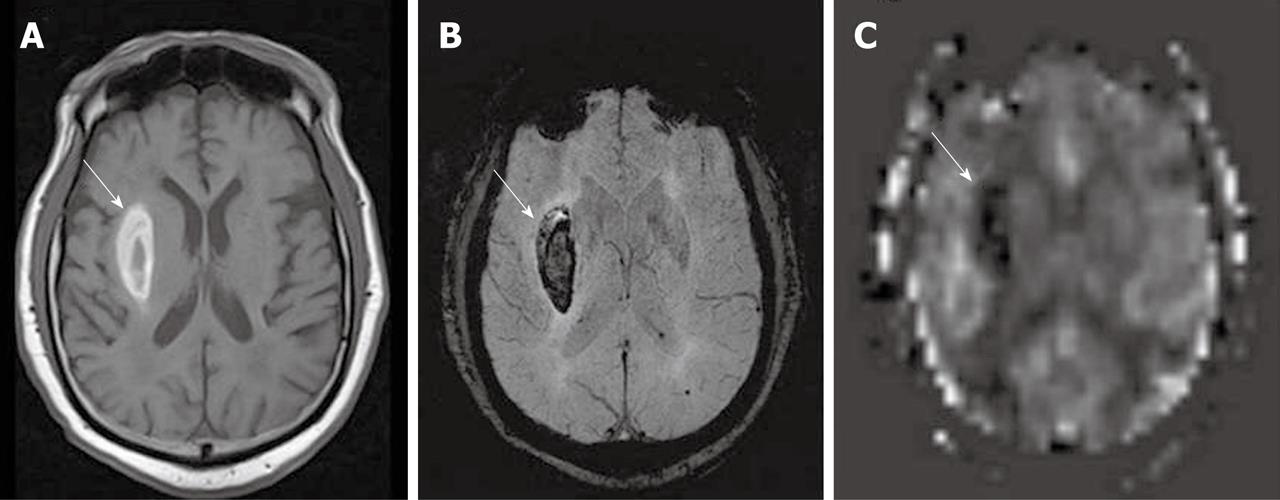
Figure 1 Right putaminal hemorrhage, seen as a bright signal intensity lesion on T1W (A), dark signal intensity on SWI (B), and dark signal on an arterial spin labeling cerebral blood flow map (C) (white arrows).
High signal intensity in an adjacent right sylvian fissure in the arterial spin labeling cerebral blood flow map may represent stagnant arterial flow due to a pressure effect from the hematoma.
- Citation: Petcharunpaisan S, Ramalho J, Castillo M. Arterial spin labeling in neuroimaging. World J Radiol 2010; 2(10): 384-398
- URL: https://www.wjgnet.com/1949-8470/full/v2/i10/384.htm
- DOI: https://dx.doi.org/10.4329/wjr.v2.i10.384


