Copyright
©2010 Baishideng Publishing Group Co.
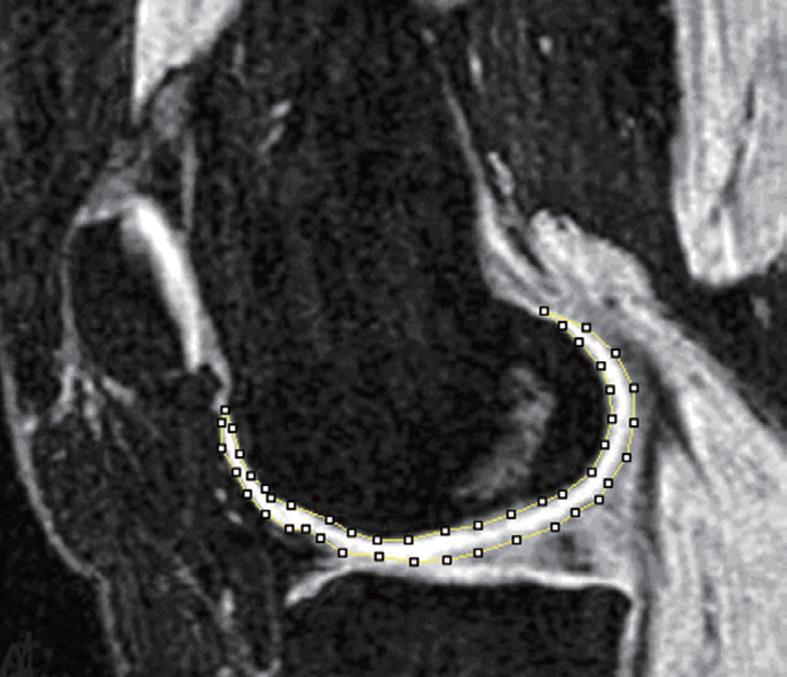
Figure 2 3D GE fat suppressed magnetic resonance imaging (MRI) at the sagittal plane.
Bone cortex, bone marrow, and fat tissue appear to have a dark signal. Muscle appears to have a gray signal and cartilage a bright signal. The femur cartilage has been manually segmented at this slice.
- Citation: Wang YXJ, Griffith JF, Ahuja AT. Non-invasive MRI assessment of the articular cartilage in clinical studies and experimental settings. World J Radiol 2010; 2(1): 44-54
- URL: https://www.wjgnet.com/1949-8470/full/v2/i1/44.htm
- DOI: https://dx.doi.org/10.4329/wjr.v2.i1.44


