Copyright
©The Author(s) 2025.
World J Radiol. Apr 28, 2025; 17(4): 103359
Published online Apr 28, 2025. doi: 10.4329/wjr.v17.i4.103359
Published online Apr 28, 2025. doi: 10.4329/wjr.v17.i4.103359
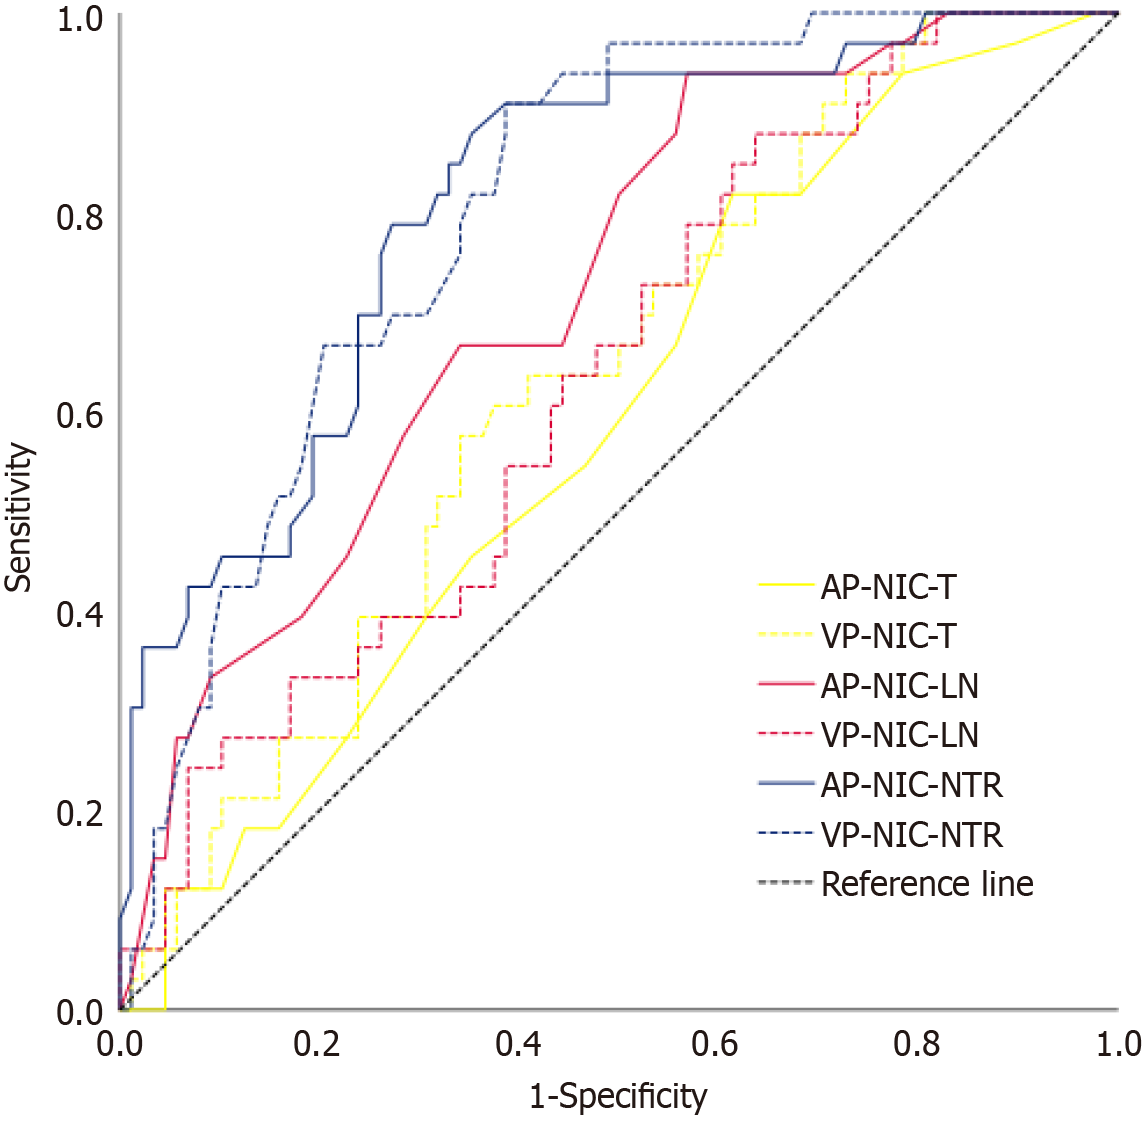
Figure 4 Receiver operating characteristic curves of the quantitative parameters used for the differential diagnosis of tumor deposits+ and tumor deposits- patients.
The areas under the curve of arterial phase-normalized iodine concentration-lymph node-to-primary tumor ratio was the highest at 0.812 (sensitivity: 0.879, specificity: 0.648, cutoff value: 1.145). AP: Arterial phase; VP: Venous phase; NIC: Normalized iodine concentration; LN: Lymph node; T: Primary tumor; NTR: Lymph node-to-primary tumor ratio.
- Citation: Lai YF, Liang ZM, Li JF, Zhang JY, Xu DH, Dai HY. Spectral computed tomography parameters of primary tumors and lymph nodes for predicting tumor deposits in colorectal cancer. World J Radiol 2025; 17(4): 103359
- URL: https://www.wjgnet.com/1949-8470/full/v17/i4/103359.htm
- DOI: https://dx.doi.org/10.4329/wjr.v17.i4.103359


