Copyright
©The Author(s) 2025.
World J Radiol. Feb 28, 2025; 17(2): 104518
Published online Feb 28, 2025. doi: 10.4329/wjr.v17.i2.104518
Published online Feb 28, 2025. doi: 10.4329/wjr.v17.i2.104518
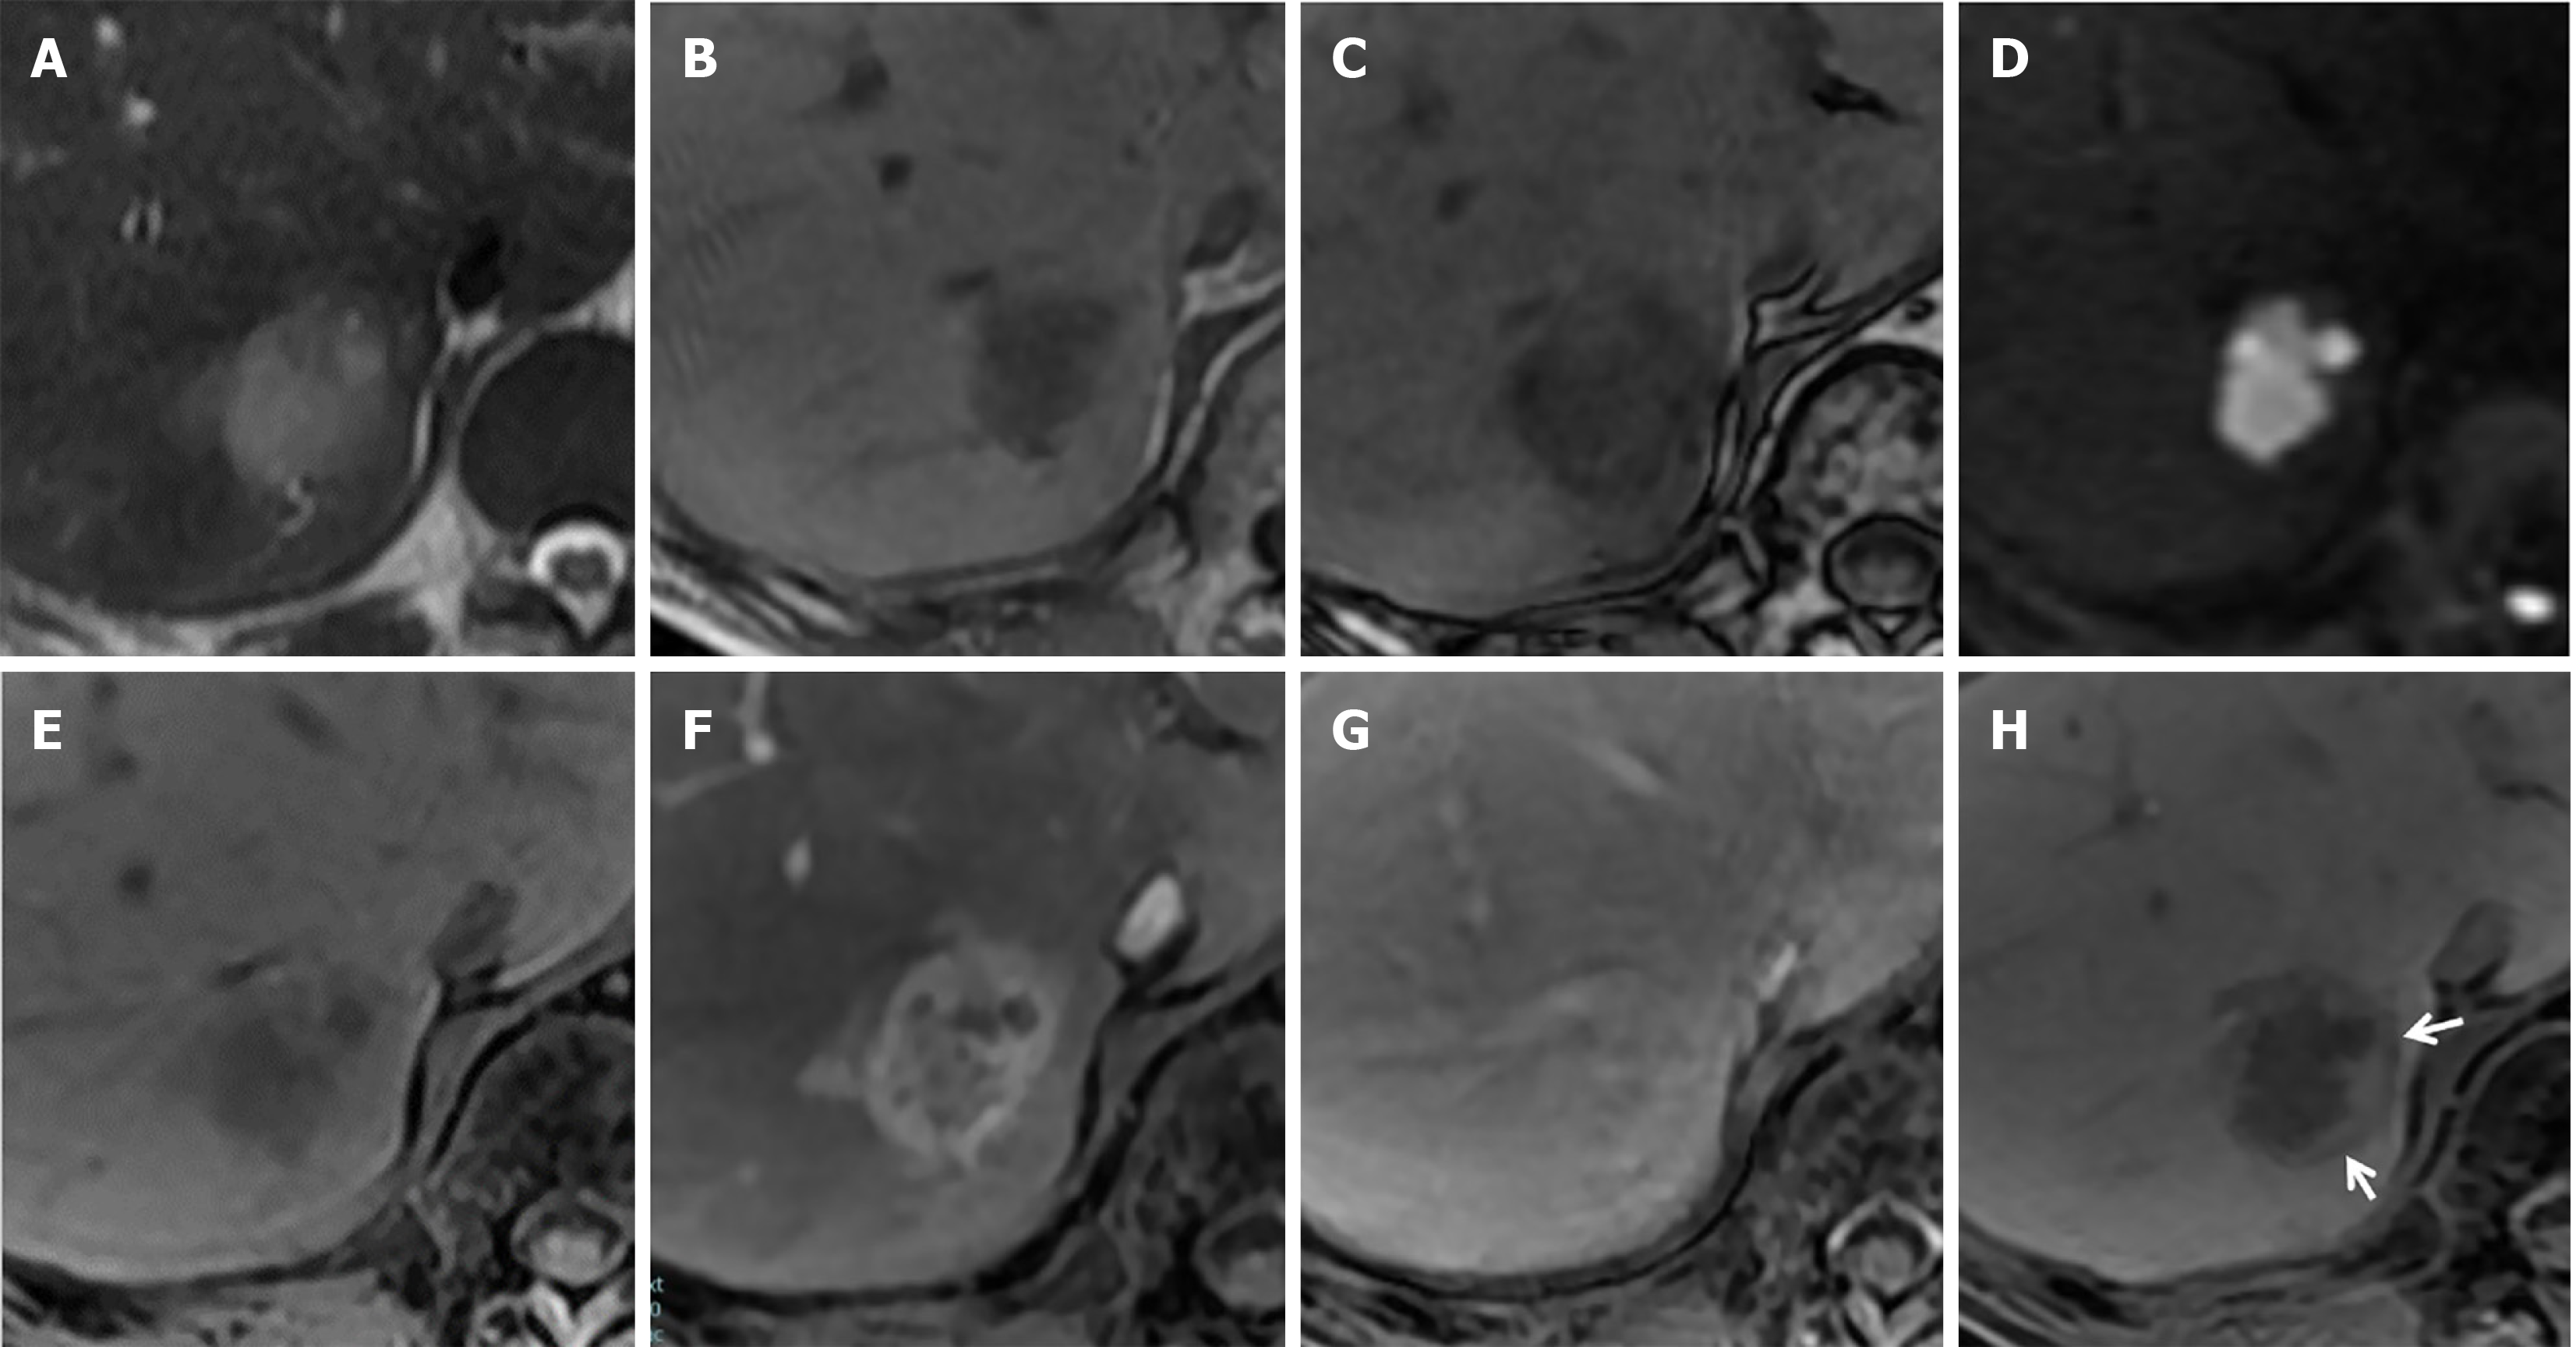
Figure 2 Gadolinium ethoxybenzyl diethylenetriamine penta-acetic acid-enhanced magnetic resonance imaging.
A: The tumor exhibited slight hyperintensity with indistinct borders on the T2-weighted image; B: The tumor showed hypointensity on the T1-weighted in-phase image; C: A signal drop at the tumor margin was observed on the T1-weighted out-phase image; D: The tumor showed hyperintensity on the diffusion-weighted image; E: The tumor showed hypointensity on the fat-saturated T1-weighted image; F: In the arterial phase, the tumor showed well-defined, peripheral-dominant enhancement; G: In the delayed phase, progressive enhancement was observed in the central area of the tumor; H: In the hepatobiliary phase, the peripheral area of the tumor showed hyperintensity, with a surrounding rim-like hypointensity detected around it (arrows).
- Citation: Irizato M, Minamiguchi K, Fujita Y, Yamaura H, Onaya H, Taiji R, Tanaka T, Inaba Y. Distinctive imaging features of liver metastasis from gastric adenocarcinoma with enteroblastic differentiation: A case report. World J Radiol 2025; 17(2): 104518
- URL: https://www.wjgnet.com/1949-8470/full/v17/i2/104518.htm
- DOI: https://dx.doi.org/10.4329/wjr.v17.i2.104518


