Copyright
©The Author(s) 2025.
World J Radiol. Jan 28, 2025; 17(1): 100794
Published online Jan 28, 2025. doi: 10.4329/wjr.v17.i1.100794
Published online Jan 28, 2025. doi: 10.4329/wjr.v17.i1.100794
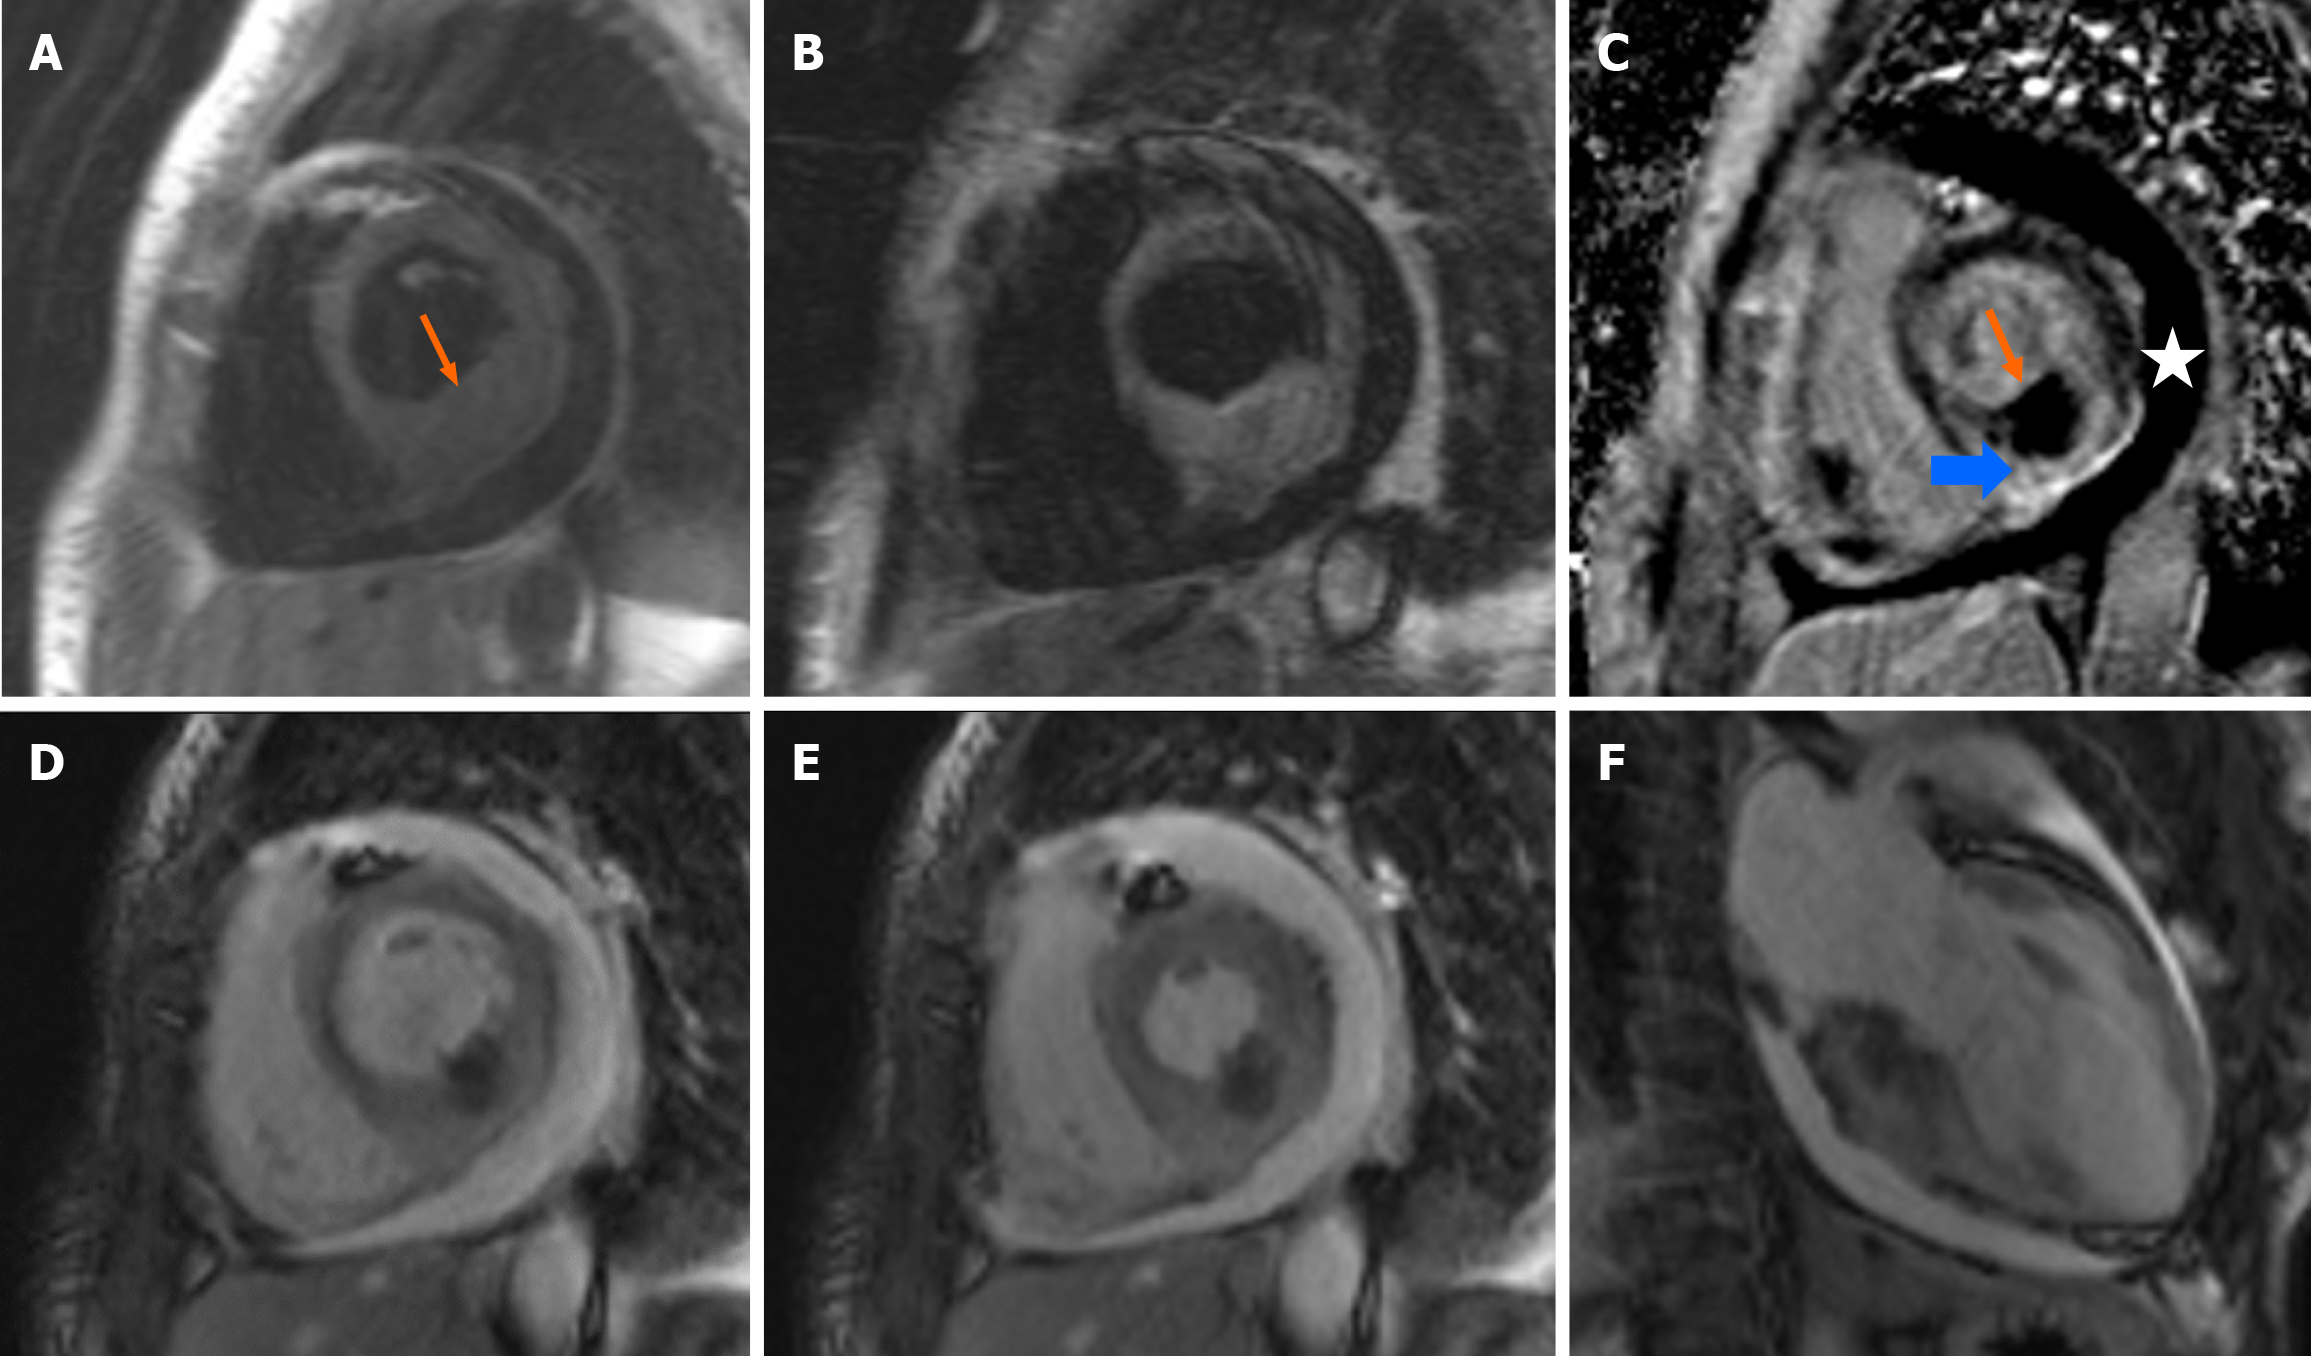
Figure 4 Cardiac magnetic resonance imaging study.
A-E: Basal short-axis plane; in T1-weighted image the basal inferior wall has mostly isointense signal and a small subepicardial area of mildly hypointense signal compared to the rest of myocardium (A); in T2-weighted (STIR) image the basal inferior wall has mostly hyperintense signal with area of hypointense subendocardial signal (B); in late gadolinium enhancement image there is increased signal intensity in the basal inferior wall (blue arrow) indicative of scar and extremely decreased signal intensity in the subendocardial region (orange arrow). Asterisk indicates pericardial effusion (C); end-diastolic frame post-Gadolinium administration (D); end-systolic frame of the same acquisition (E); F: End-diastolic frame in cine post-gadolinium acquisition in 2-chamber view.
- Citation: Latsios G, Dimitroglou Y, Lazaros G, Alexopoulos N, Tolis I, Aggeli C, Tsioufis C. Differentiating between immune checkpoint inhibitor-induced myocarditis and cardiac metastasis in a cardio-oncology patient presenting with myocardial infarction: A case report. World J Radiol 2025; 17(1): 100794
- URL: https://www.wjgnet.com/1949-8470/full/v17/i1/100794.htm
- DOI: https://dx.doi.org/10.4329/wjr.v17.i1.100794


