Copyright
©The Author(s) 2024.
World J Radiol. Sep 28, 2024; 16(9): 418-428
Published online Sep 28, 2024. doi: 10.4329/wjr.v16.i9.418
Published online Sep 28, 2024. doi: 10.4329/wjr.v16.i9.418
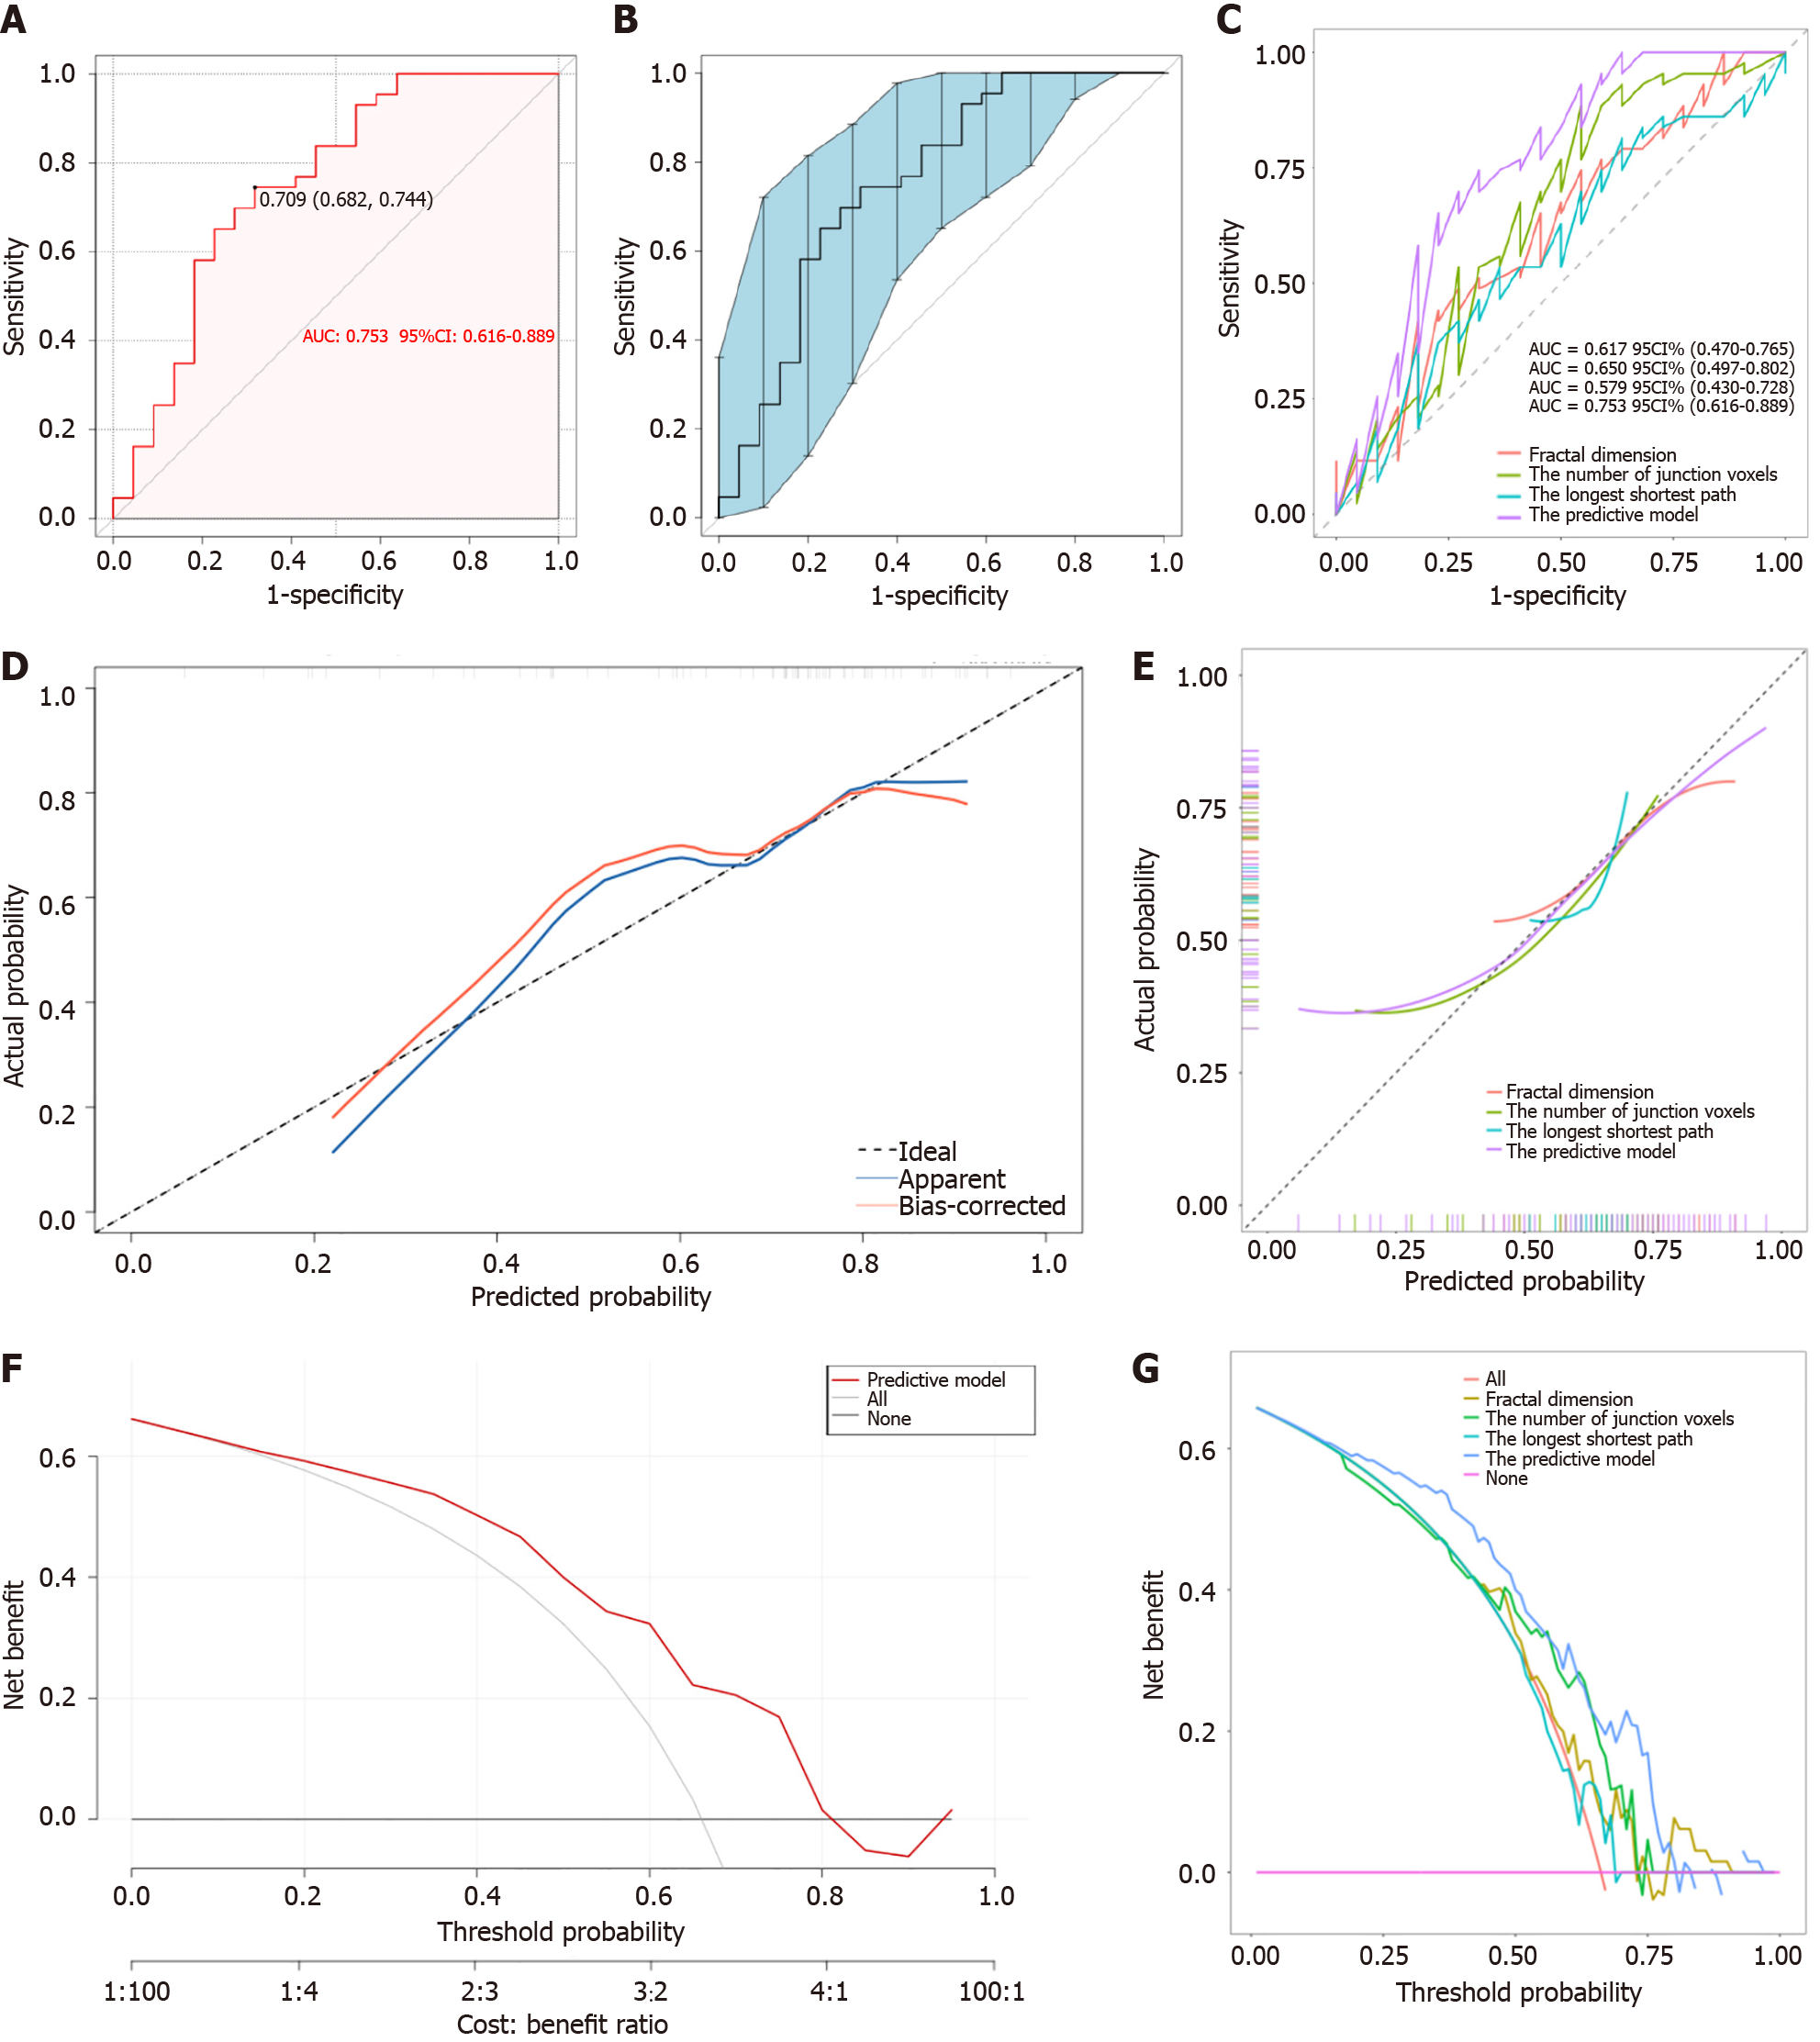
Figure 5 Area under the receiver operating characteristic curve, calibration curve, and decision curve analysis for the model predicting anti-vascular endothelial growth factor therapy response.
A: Receiver operating characteristic (ROC) curve for the predictive model; B: ROC curves based on 500 bootstrap re-samples; C: ROC curves comparing different models; D: Calibration curves based on 500 bootstrap re-samples; E: Calibration curves comparing different models; F: Decision curve analysis based on 500 bootstrap re-samples; G: Decision curve analysis comparing different models.
- Citation: Huang ZH, Tu XZ, Lin Q, Tu M, Lin GC, Zhang KP. Nomogram for predicting short-term response to anti-vascular endothelial growth factor treatment in neovascular age-related macular degeneration: An observational study. World J Radiol 2024; 16(9): 418-428
- URL: https://www.wjgnet.com/1949-8470/full/v16/i9/418.htm
- DOI: https://dx.doi.org/10.4329/wjr.v16.i9.418


