Copyright
©The Author(s) 2024.
World J Radiol. Aug 28, 2024; 16(8): 329-336
Published online Aug 28, 2024. doi: 10.4329/wjr.v16.i8.329
Published online Aug 28, 2024. doi: 10.4329/wjr.v16.i8.329
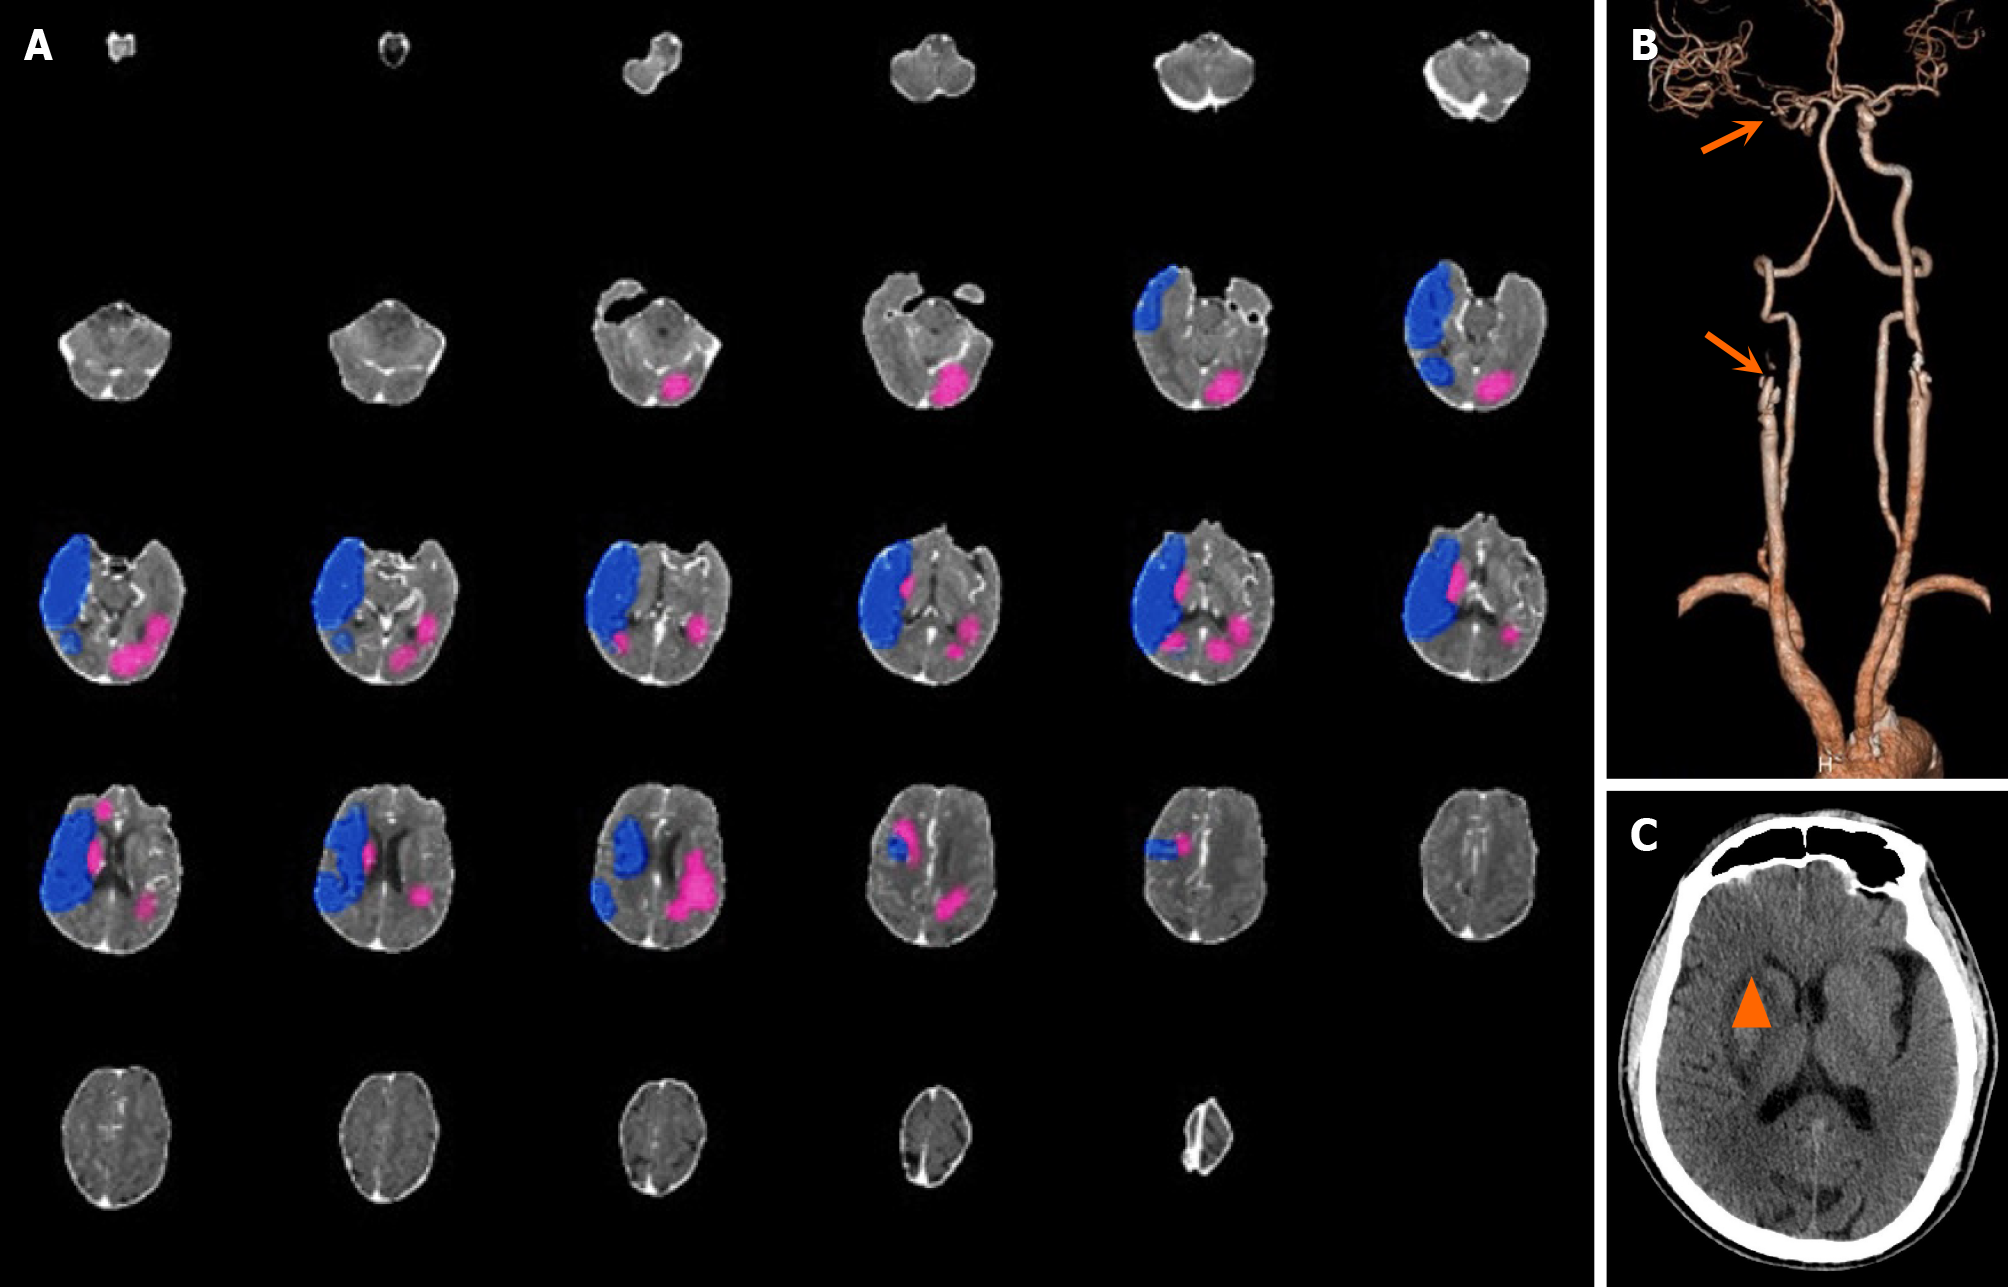
Figure 3 Imaging findings regarding cerebral perfusion, core infarction, and cerebral arteries of case 3.
A: Computed tomography (CT) image of brain perfusion (Shukun) suggested that the core infarction volume was 30.4 mL mainly in the left cerebral hemisphere (pink area), but a low perfusion volume of 119.3 mL in the right hemisphere (blue area); B: Head and neck CT angiography indicated right internal carotid artery occlusion and right middle cerebral artery occlusion (arrow); C: Brain CT image showing right basal ganglia infarction 5 days after mechanical thrombectomy (triangle).
- Citation: Li ZQ, Liu W, Luo WL, Chen SQ, Deng YP. Artificial intelligence software for assessing brain ischemic penumbra/core infarction on computed tomography perfusion: A real-world accuracy study. World J Radiol 2024; 16(8): 329-336
- URL: https://www.wjgnet.com/1949-8470/full/v16/i8/329.htm
- DOI: https://dx.doi.org/10.4329/wjr.v16.i8.329


