Copyright
©The Author(s) 2024.
World J Radiol. Jun 28, 2024; 16(6): 139-167
Published online Jun 28, 2024. doi: 10.4329/wjr.v16.i6.139
Published online Jun 28, 2024. doi: 10.4329/wjr.v16.i6.139
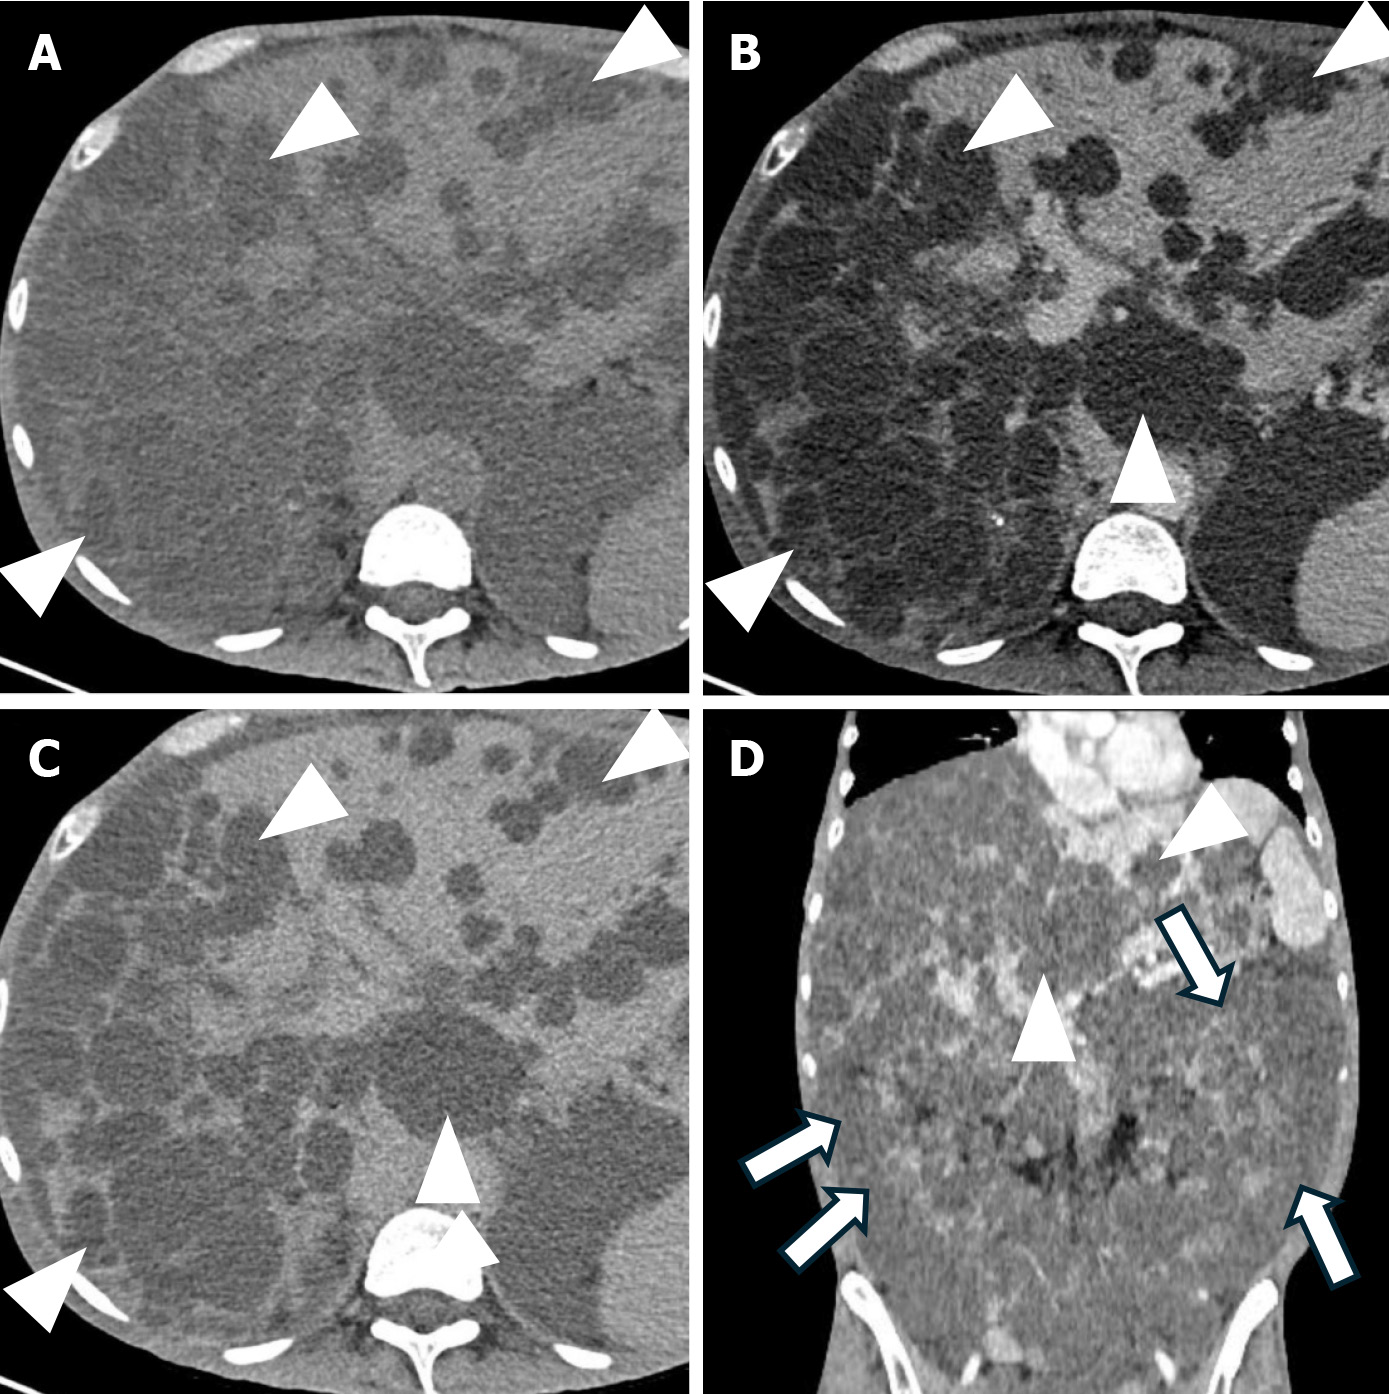
Figure 7 Polycystic liver disease.
A: Axial non-contrast computed tomography (CT) image demonstrates multiple hypodense lesions (arrowheads); B: Axial contrast-enhanced CT image in the portal venous phase shows multiple hypodense lesions with no enhancement (arrowheads); C: Axial contrast-enhanced CT image in the delayed phase demonstrates multiple hypodense lesions with no enhancement (arrowheads); D: Coronal contrast-enhanced CT image in the portal venous phase shows multiple hepatic (arrowheads) and renal (arrows) cysts.
- Citation: Kahraman G, Haberal KM, Dilek ON. Imaging features and management of focal liver lesions. World J Radiol 2024; 16(6): 139-167
- URL: https://www.wjgnet.com/1949-8470/full/v16/i6/139.htm
- DOI: https://dx.doi.org/10.4329/wjr.v16.i6.139


