Copyright
©The Author(s) 2024.
World J Radiol. Jun 28, 2024; 16(6): 139-167
Published online Jun 28, 2024. doi: 10.4329/wjr.v16.i6.139
Published online Jun 28, 2024. doi: 10.4329/wjr.v16.i6.139
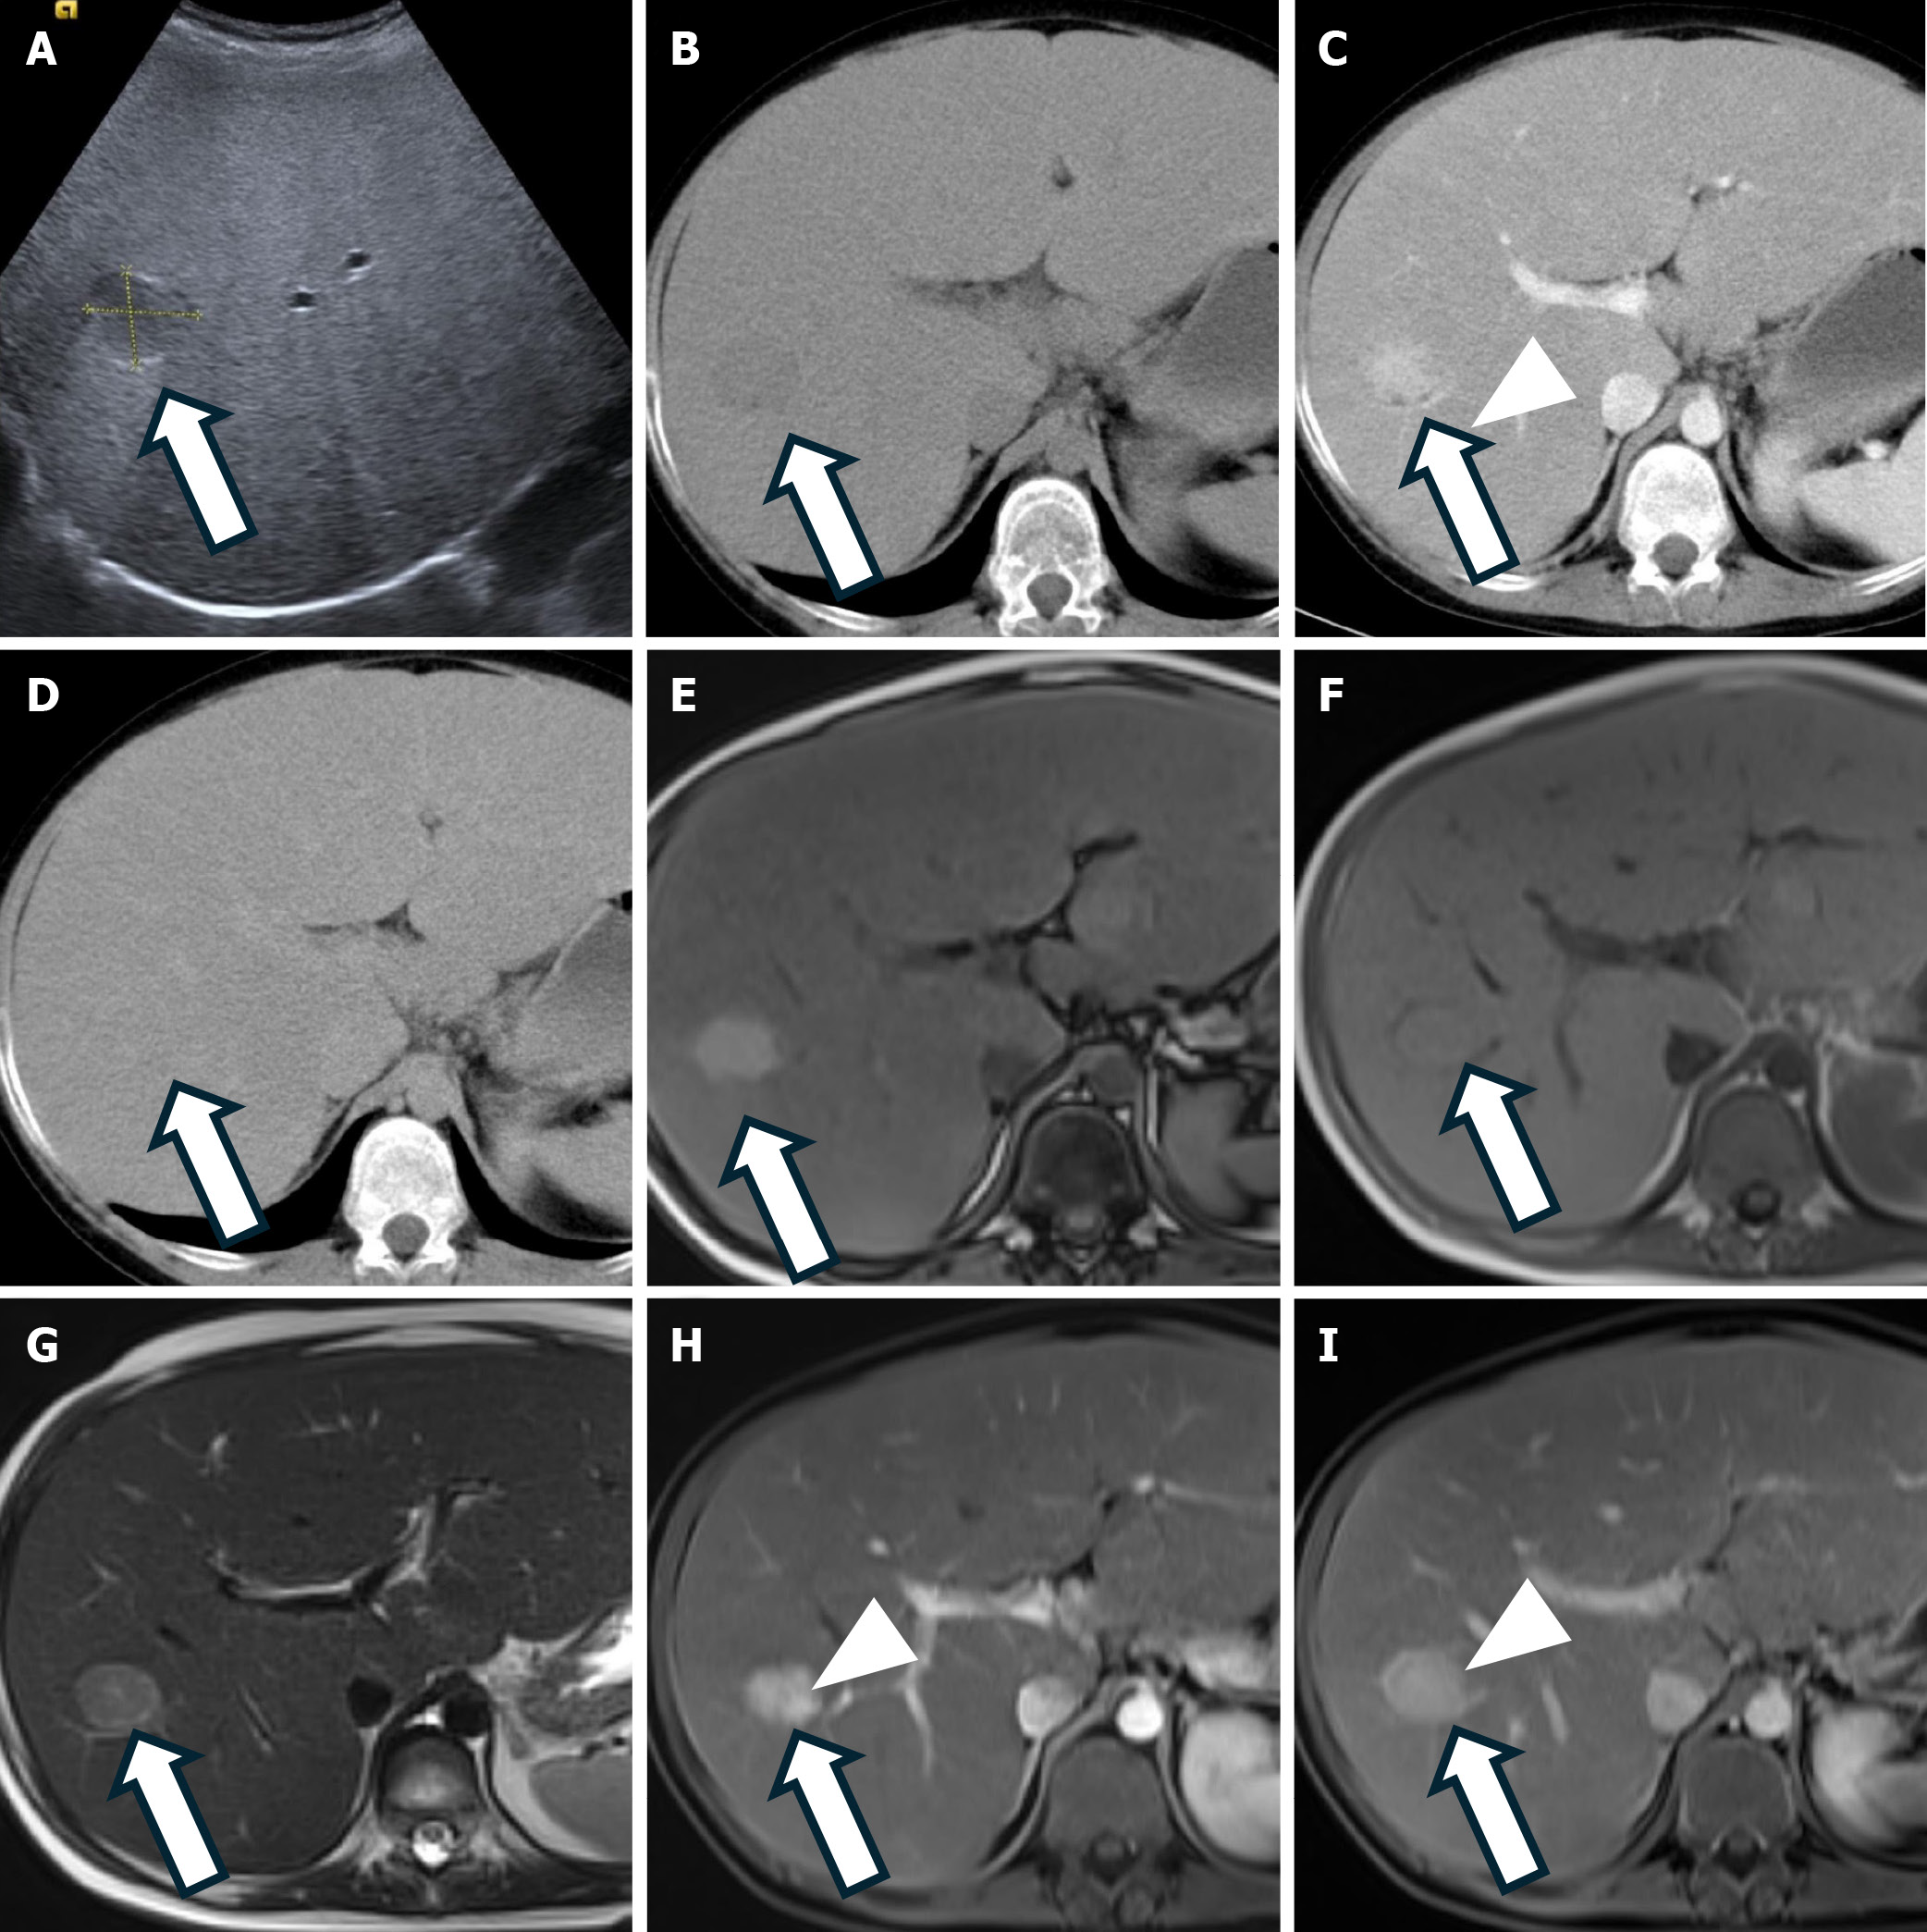
Figure 5 Hepatocellular adenoma, inflammatory subtype.
A: Ultrasound shows a hypoechoic well-defined lesion (arrow) in the right lobe of the liver; B: Axial non-contrast computed tomography (CT) image demonstrates a hypodense lesion (arrow); C: Arterial phase CT shows the lesion with homogenous enhancement (arrowhead); D: In the portal venous phase, the lesion appears isodense to the surrounding liver parenchyma (arrow); E and F: Axial T1-weighted images in opposed phase (E) and in-phase (F) show the lesion (arrow) with no signal drop on the opposed-phase image; G: Axial T2-weighted magnetic resonance imaging (MRI) shows a hyperintense lesion (arrow). H: Arterial phase T1-weighted MRI with an extracellular gadolinium-based contrast agent demonstrates heterogeneous enhancement (arrowhead); I: Portal venous phase T1-weighted MRI continues to show heterogeneous enhancement of the lesion (arrowhead) with no washout.
- Citation: Kahraman G, Haberal KM, Dilek ON. Imaging features and management of focal liver lesions. World J Radiol 2024; 16(6): 139-167
- URL: https://www.wjgnet.com/1949-8470/full/v16/i6/139.htm
- DOI: https://dx.doi.org/10.4329/wjr.v16.i6.139


