Copyright
©The Author(s) 2024.
World J Radiol. Jun 28, 2024; 16(6): 139-167
Published online Jun 28, 2024. doi: 10.4329/wjr.v16.i6.139
Published online Jun 28, 2024. doi: 10.4329/wjr.v16.i6.139
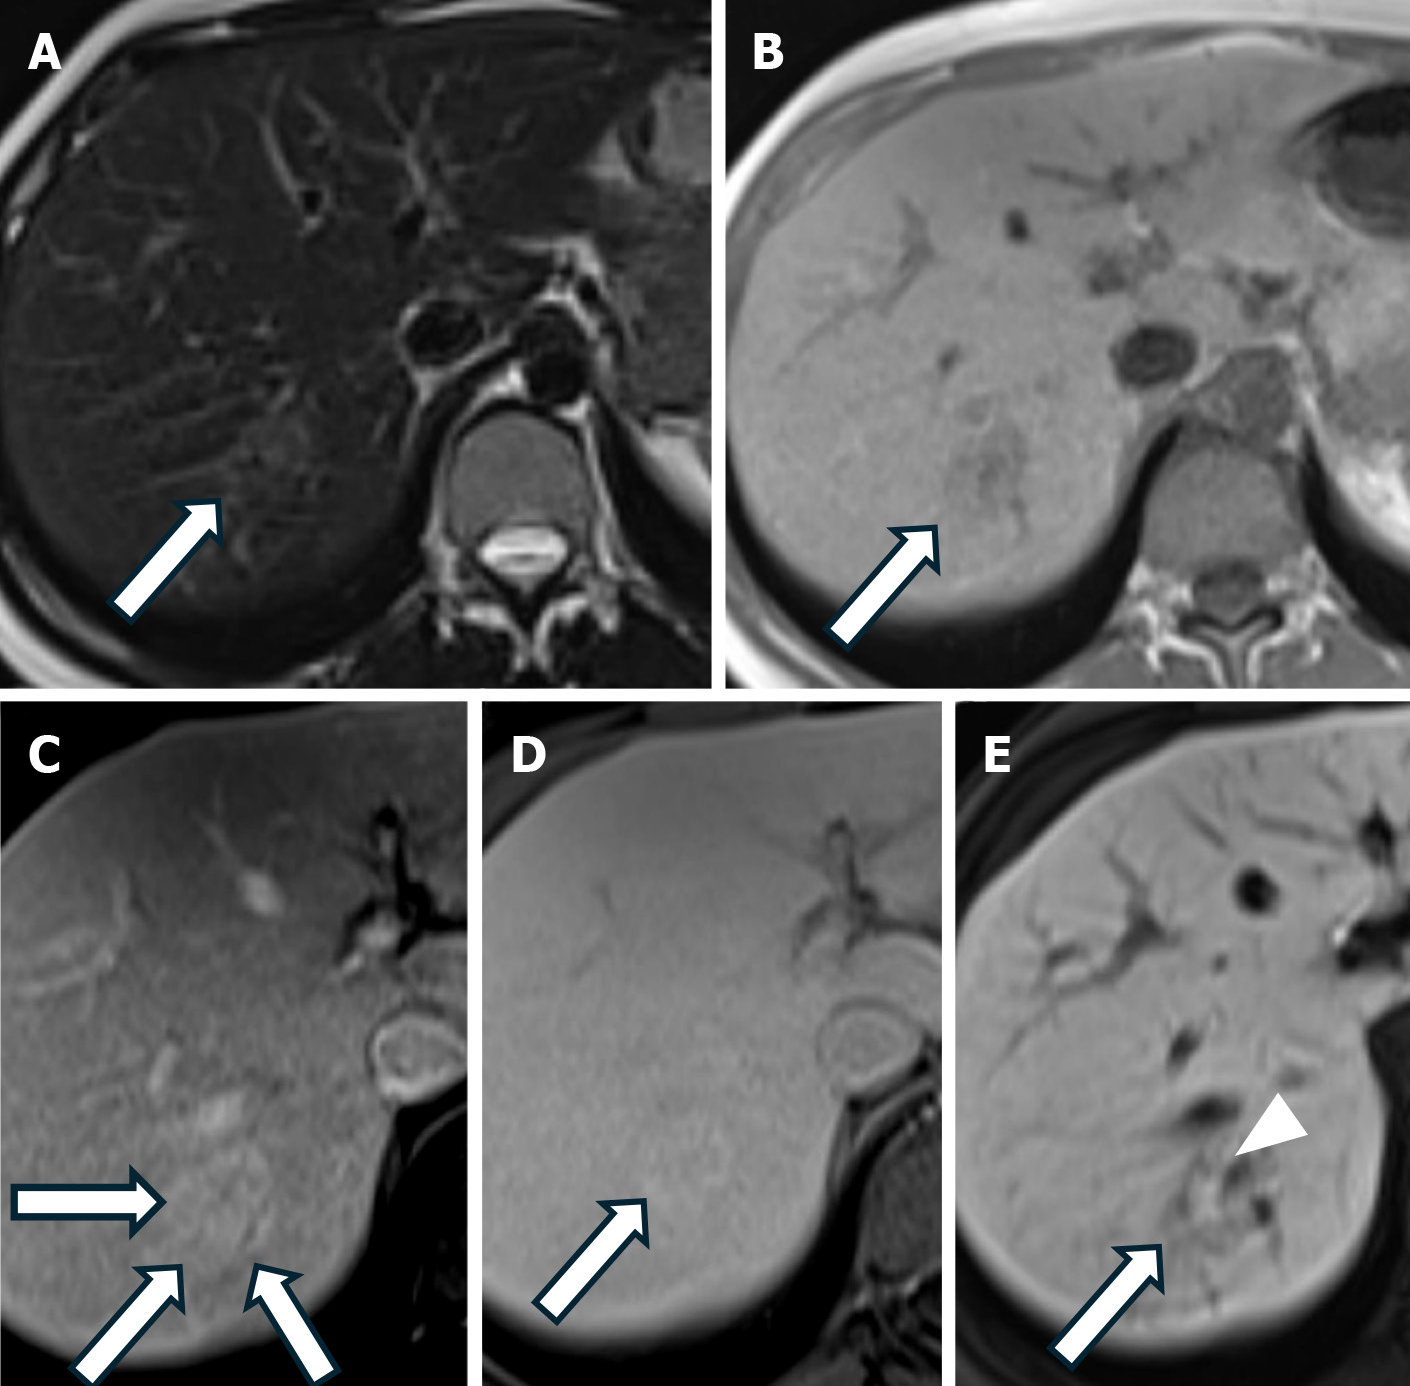
Figure 4 Focal nodular hyperplasia.
A: Axial T2-weighted magnetic resonance imaging (MRI)shows a slightly hyperintense lesion (arrow); B: Axial T1-weighted MRI reveals a slightly hypointense lesion (arrow); C: Arterial phase T1-weighted MRI with a hepatobiliary-specific contrast agent shows homogenous enhancement of the lesion (arrows); D: Portal venous phase T1-weighted MRI indicates the lesion is isointense (arrow); E: Hepatobiliary phase T1-weighted MRI shows persistent peripheral enhancement of the lesion (arrow) with a hypointense central scar (arrowhead).
- Citation: Kahraman G, Haberal KM, Dilek ON. Imaging features and management of focal liver lesions. World J Radiol 2024; 16(6): 139-167
- URL: https://www.wjgnet.com/1949-8470/full/v16/i6/139.htm
- DOI: https://dx.doi.org/10.4329/wjr.v16.i6.139


