Copyright
©The Author(s) 2024.
World J Radiol. May 28, 2024; 16(5): 115-127
Published online May 28, 2024. doi: 10.4329/wjr.v16.i5.115
Published online May 28, 2024. doi: 10.4329/wjr.v16.i5.115
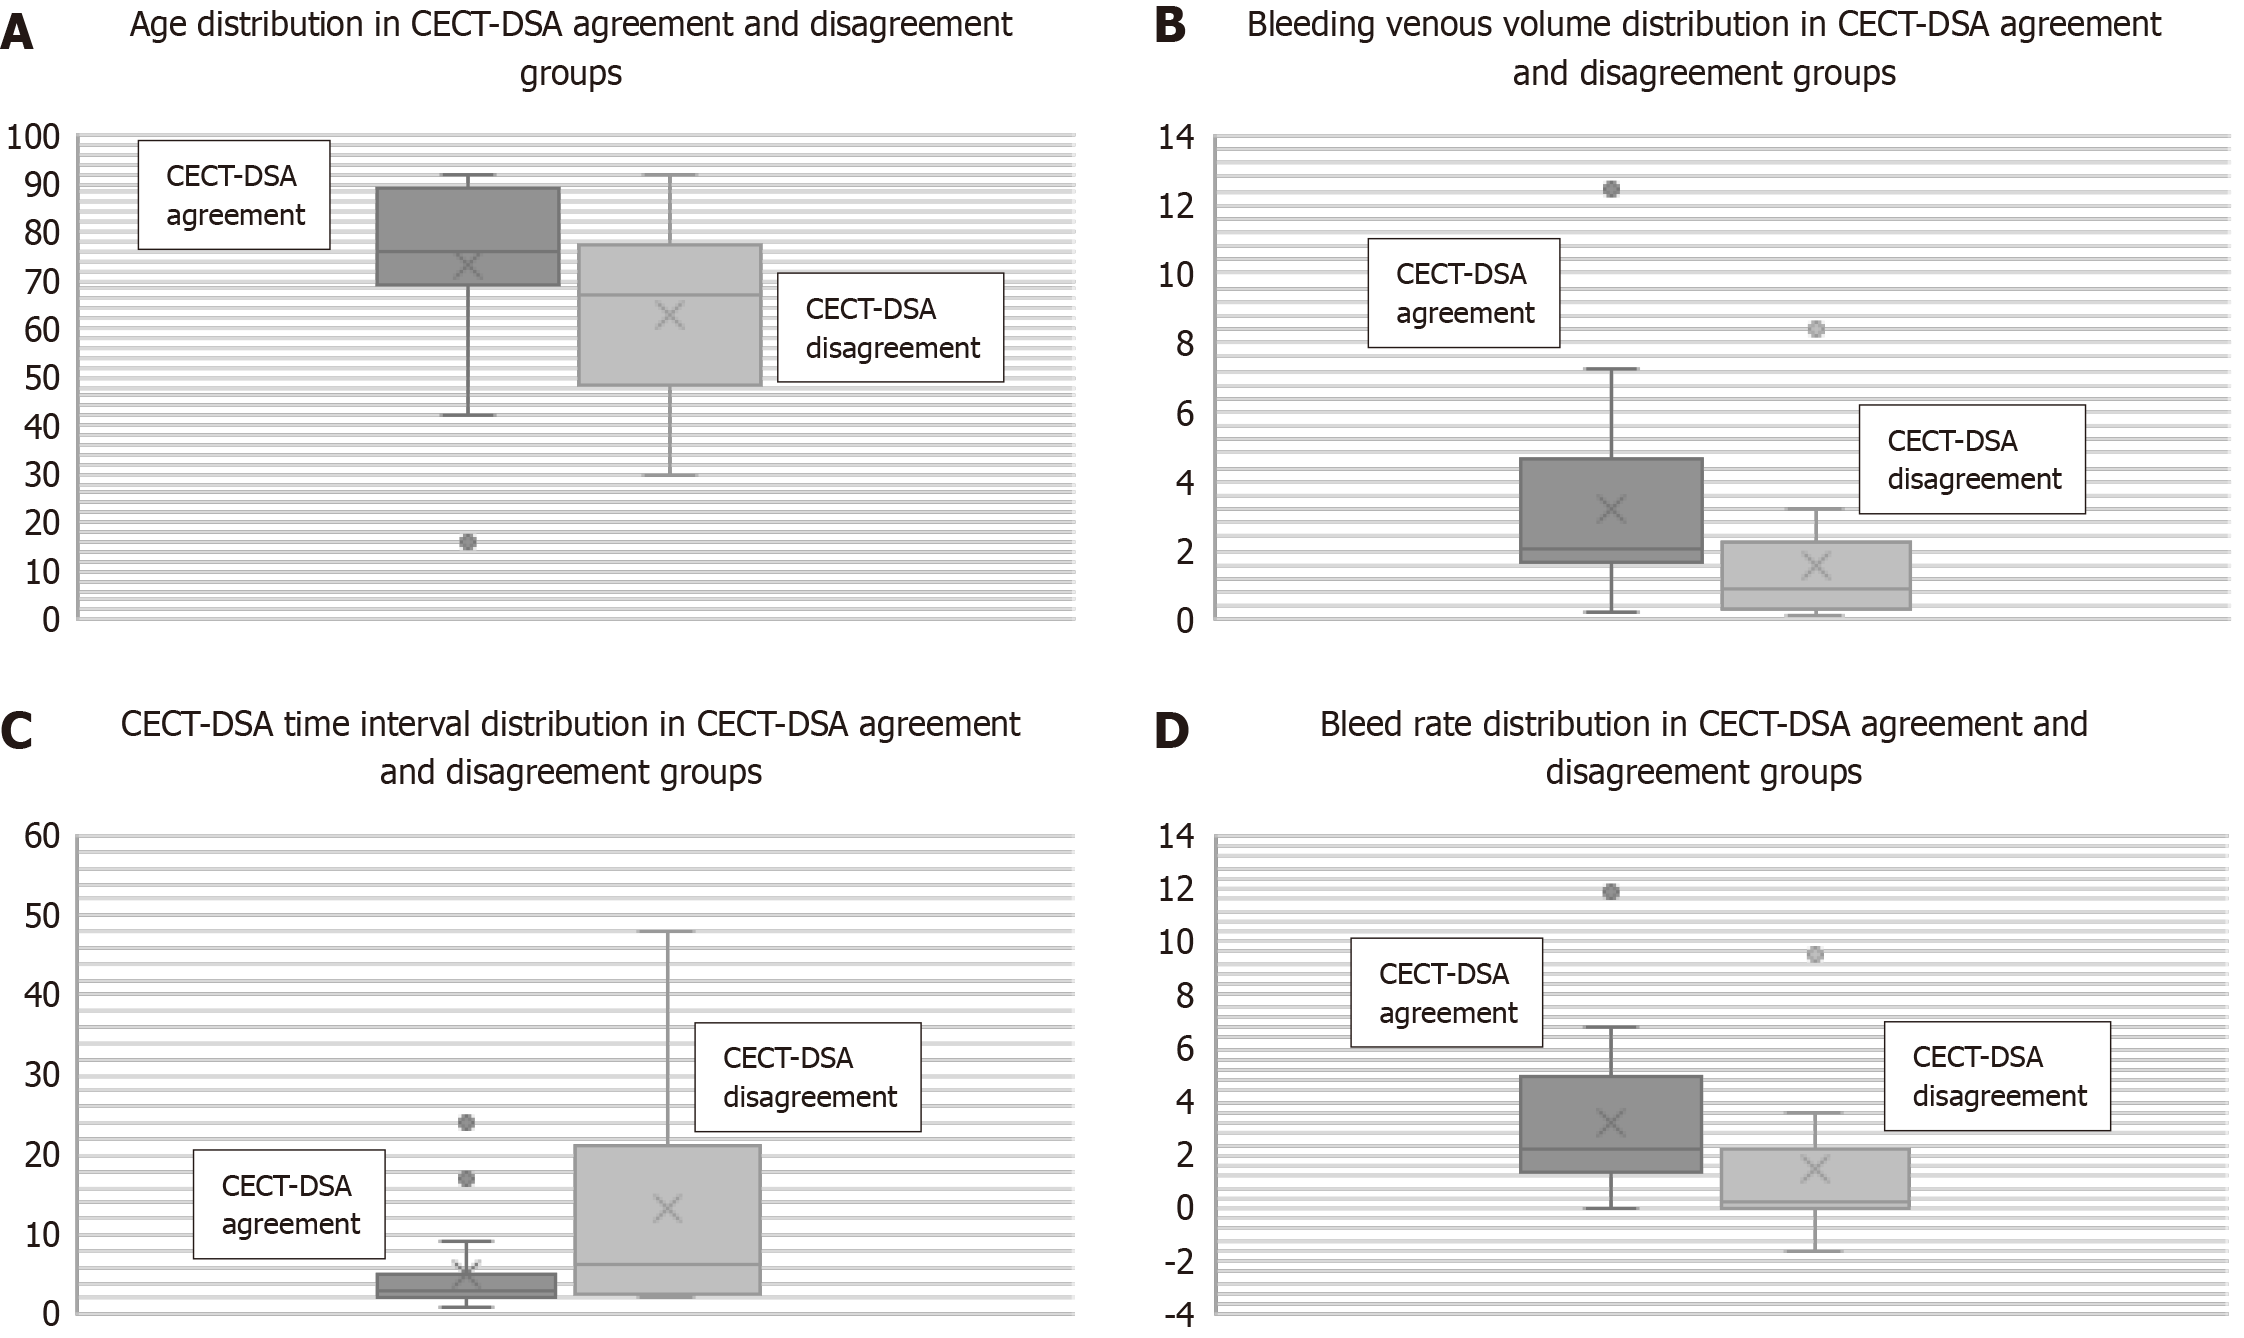
Figure 1 Box-plot graphical representations comparing concordance and no-concordance groups.
A: Box-plot graphical representation of age distribution in the two study groups; B: Box-plot graphical representation of bleeding venous volume distribution in the two study groups; C: Box-plot graphical representation of computed tomography angiography-angiography time interval distribution in the two study groups; D: Box-plot graphical representation of bleed rate distribution in the two study groups. CECT-DSA: Contrast-enhanced computed tomography-digital subtraction angiography.
- Citation: Cacioppa LM, Floridi C, Bruno A, Rossini N, Valeri T, Borgheresi A, Inchingolo R, Cortese F, Novelli G, Felicioli A, Torresi M, Boscarato P, Ottaviani L, Giovagnoni A. Extravasated contrast volumetric assessment on computed tomography angiography in gastrointestinal bleeding: A useful predictor of positive angiographic findings. World J Radiol 2024; 16(5): 115-127
- URL: https://www.wjgnet.com/1949-8470/full/v16/i5/115.htm
- DOI: https://dx.doi.org/10.4329/wjr.v16.i5.115


