Copyright
©The Author(s) 2024.
World J Radiol. Dec 28, 2024; 16(12): 782-793
Published online Dec 28, 2024. doi: 10.4329/wjr.v16.i12.782
Published online Dec 28, 2024. doi: 10.4329/wjr.v16.i12.782
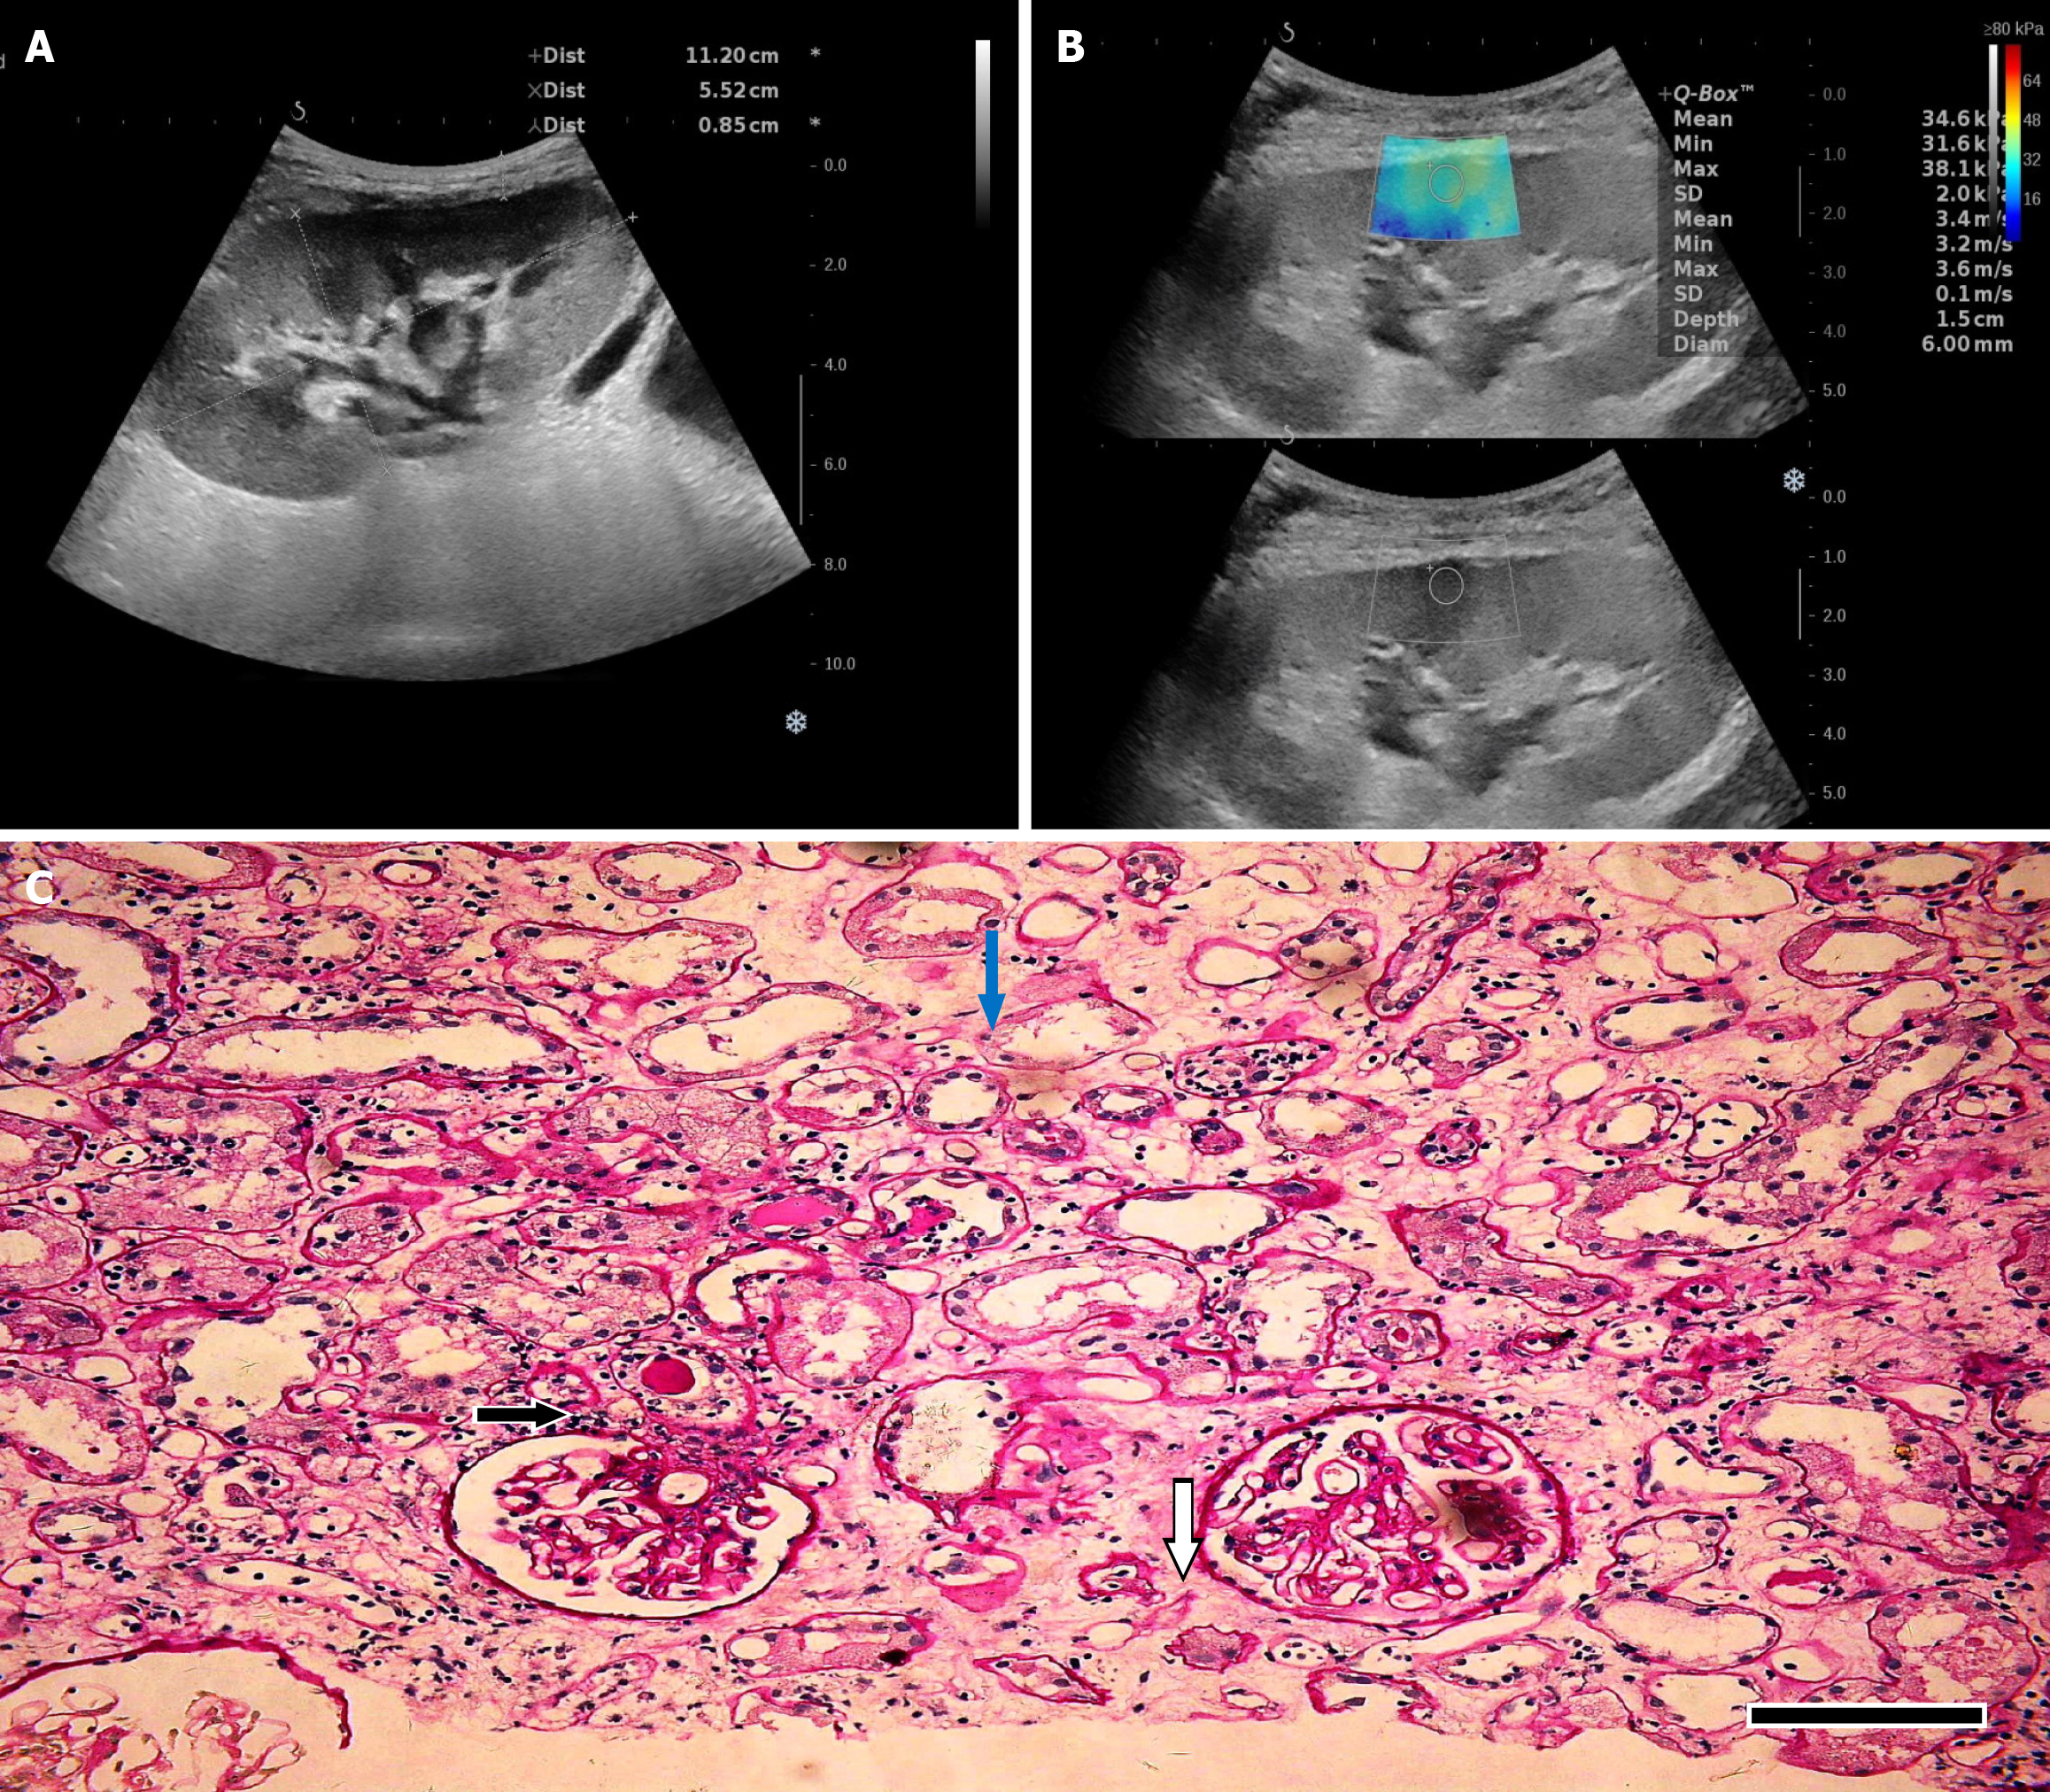
Figure 6 Quantitative elastography measurement at the interpolar region of a transplant kidney with acute allograft dysfunction due to acute cellular rejection.
A: Gray scale image; B: Color-coded map of elasticity value distribution on a scale of 0 to 80 kPa and corresponding gray scale image (mean value 346 kPa and 3.4 m/s); C: Histopathological section shows severe tubulitis (blue arrow) along with tubulo-interstitial inflammation (black arrow) and interstitial edema (white arrow) in a case of Acute T cell Mediated Cellular Rejection Banff Grade IB (× 100 original magnification, PAS stain, scale bar = 100 μm).
- Citation: Lal H, Ruidas S, Prasad R, Singh A, Prasad N, Kaul A, Bhadauria DS, Kushwaha RS, Patel MR, Jain M, Yadav P. Role of multi-parametric ultrasonography for the assessment and monitoring of functional status of renal allografts with histopathological correlation. World J Radiol 2024; 16(12): 782-793
- URL: https://www.wjgnet.com/1949-8470/full/v16/i12/782.htm
- DOI: https://dx.doi.org/10.4329/wjr.v16.i12.782


