Copyright
©The Author(s) 2024.
World J Radiol. Dec 28, 2024; 16(12): 782-793
Published online Dec 28, 2024. doi: 10.4329/wjr.v16.i12.782
Published online Dec 28, 2024. doi: 10.4329/wjr.v16.i12.782
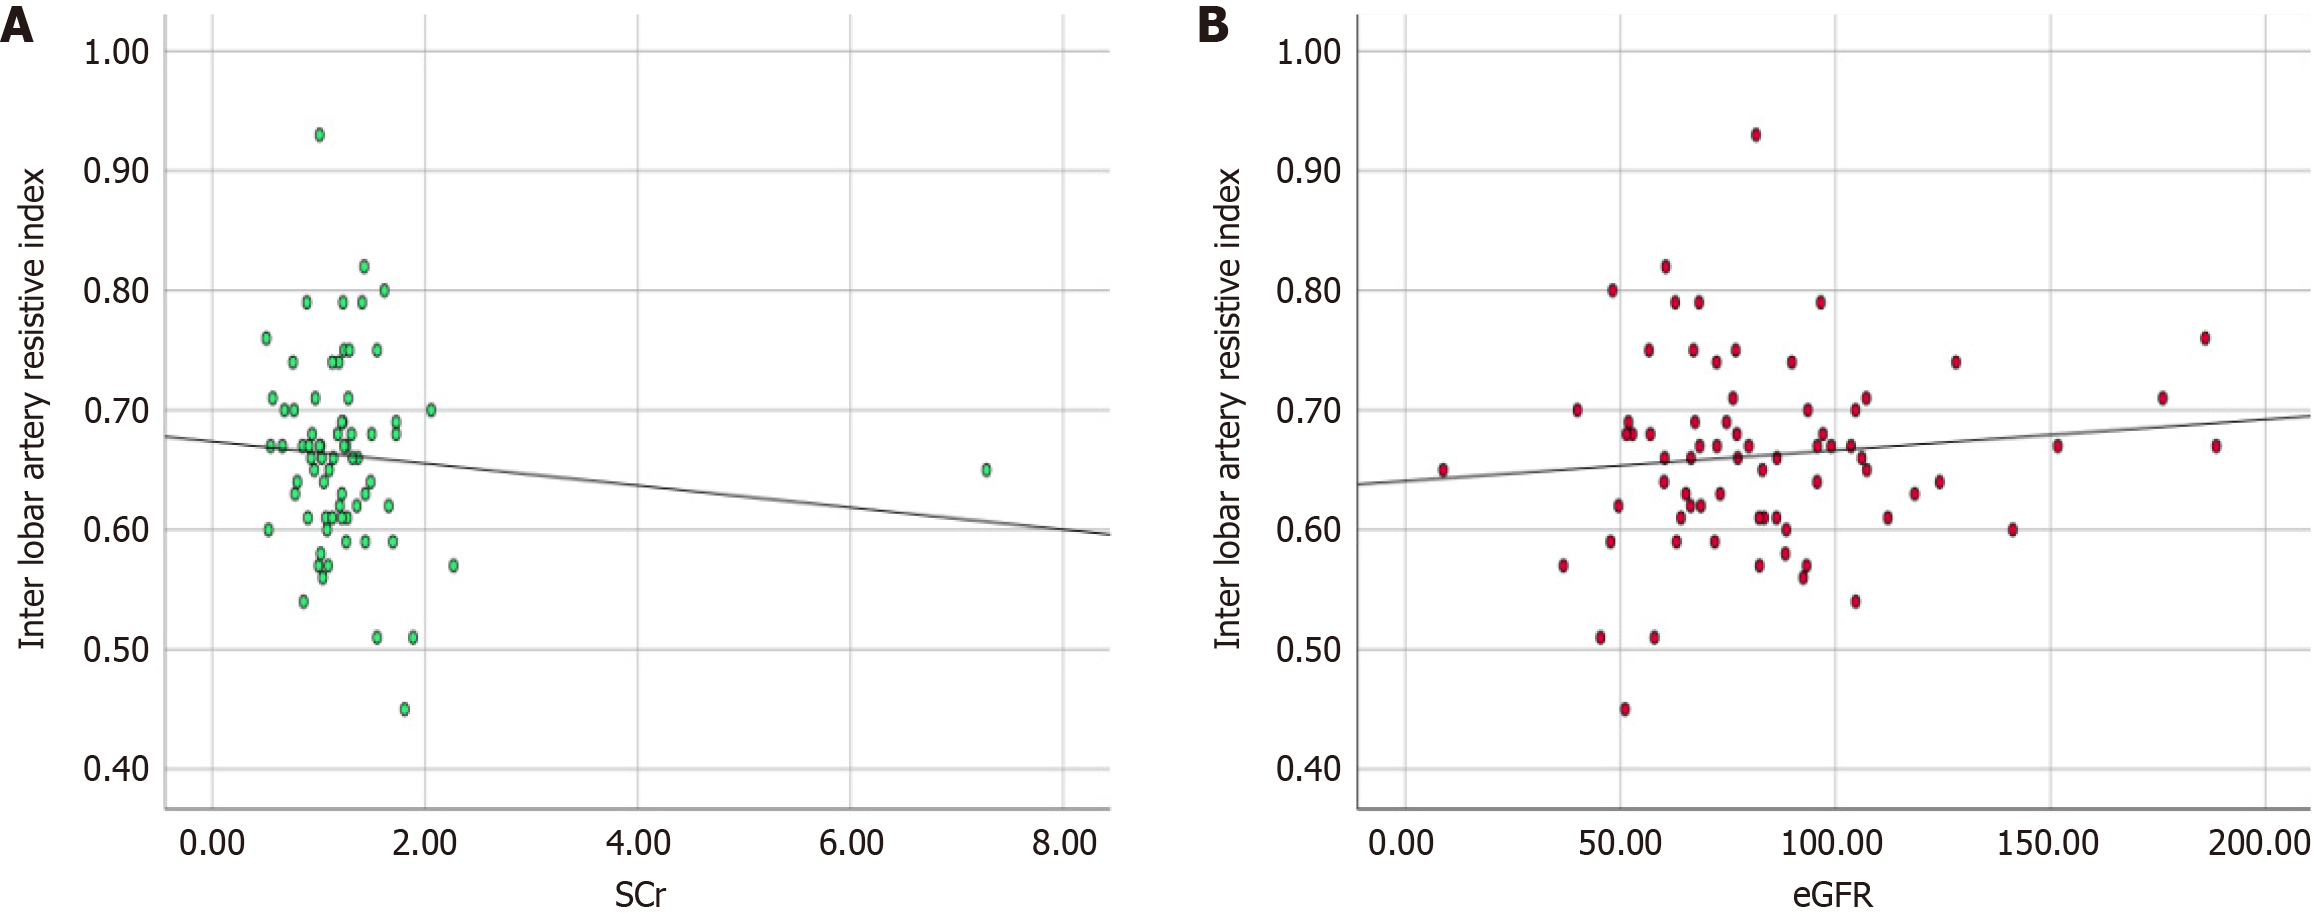
Figure 3 Graphical representation of linear regression analysis of interlobar artery resistive index values.
A: Serum creatinine; B: Estimated glomerular filtration rate (eGFR).
- Citation: Lal H, Ruidas S, Prasad R, Singh A, Prasad N, Kaul A, Bhadauria DS, Kushwaha RS, Patel MR, Jain M, Yadav P. Role of multi-parametric ultrasonography for the assessment and monitoring of functional status of renal allografts with histopathological correlation. World J Radiol 2024; 16(12): 782-793
- URL: https://www.wjgnet.com/1949-8470/full/v16/i12/782.htm
- DOI: https://dx.doi.org/10.4329/wjr.v16.i12.782


