Copyright
©The Author(s) 2024.
World J Radiol. Nov 28, 2024; 16(11): 644-656
Published online Nov 28, 2024. doi: 10.4329/wjr.v16.i11.644
Published online Nov 28, 2024. doi: 10.4329/wjr.v16.i11.644
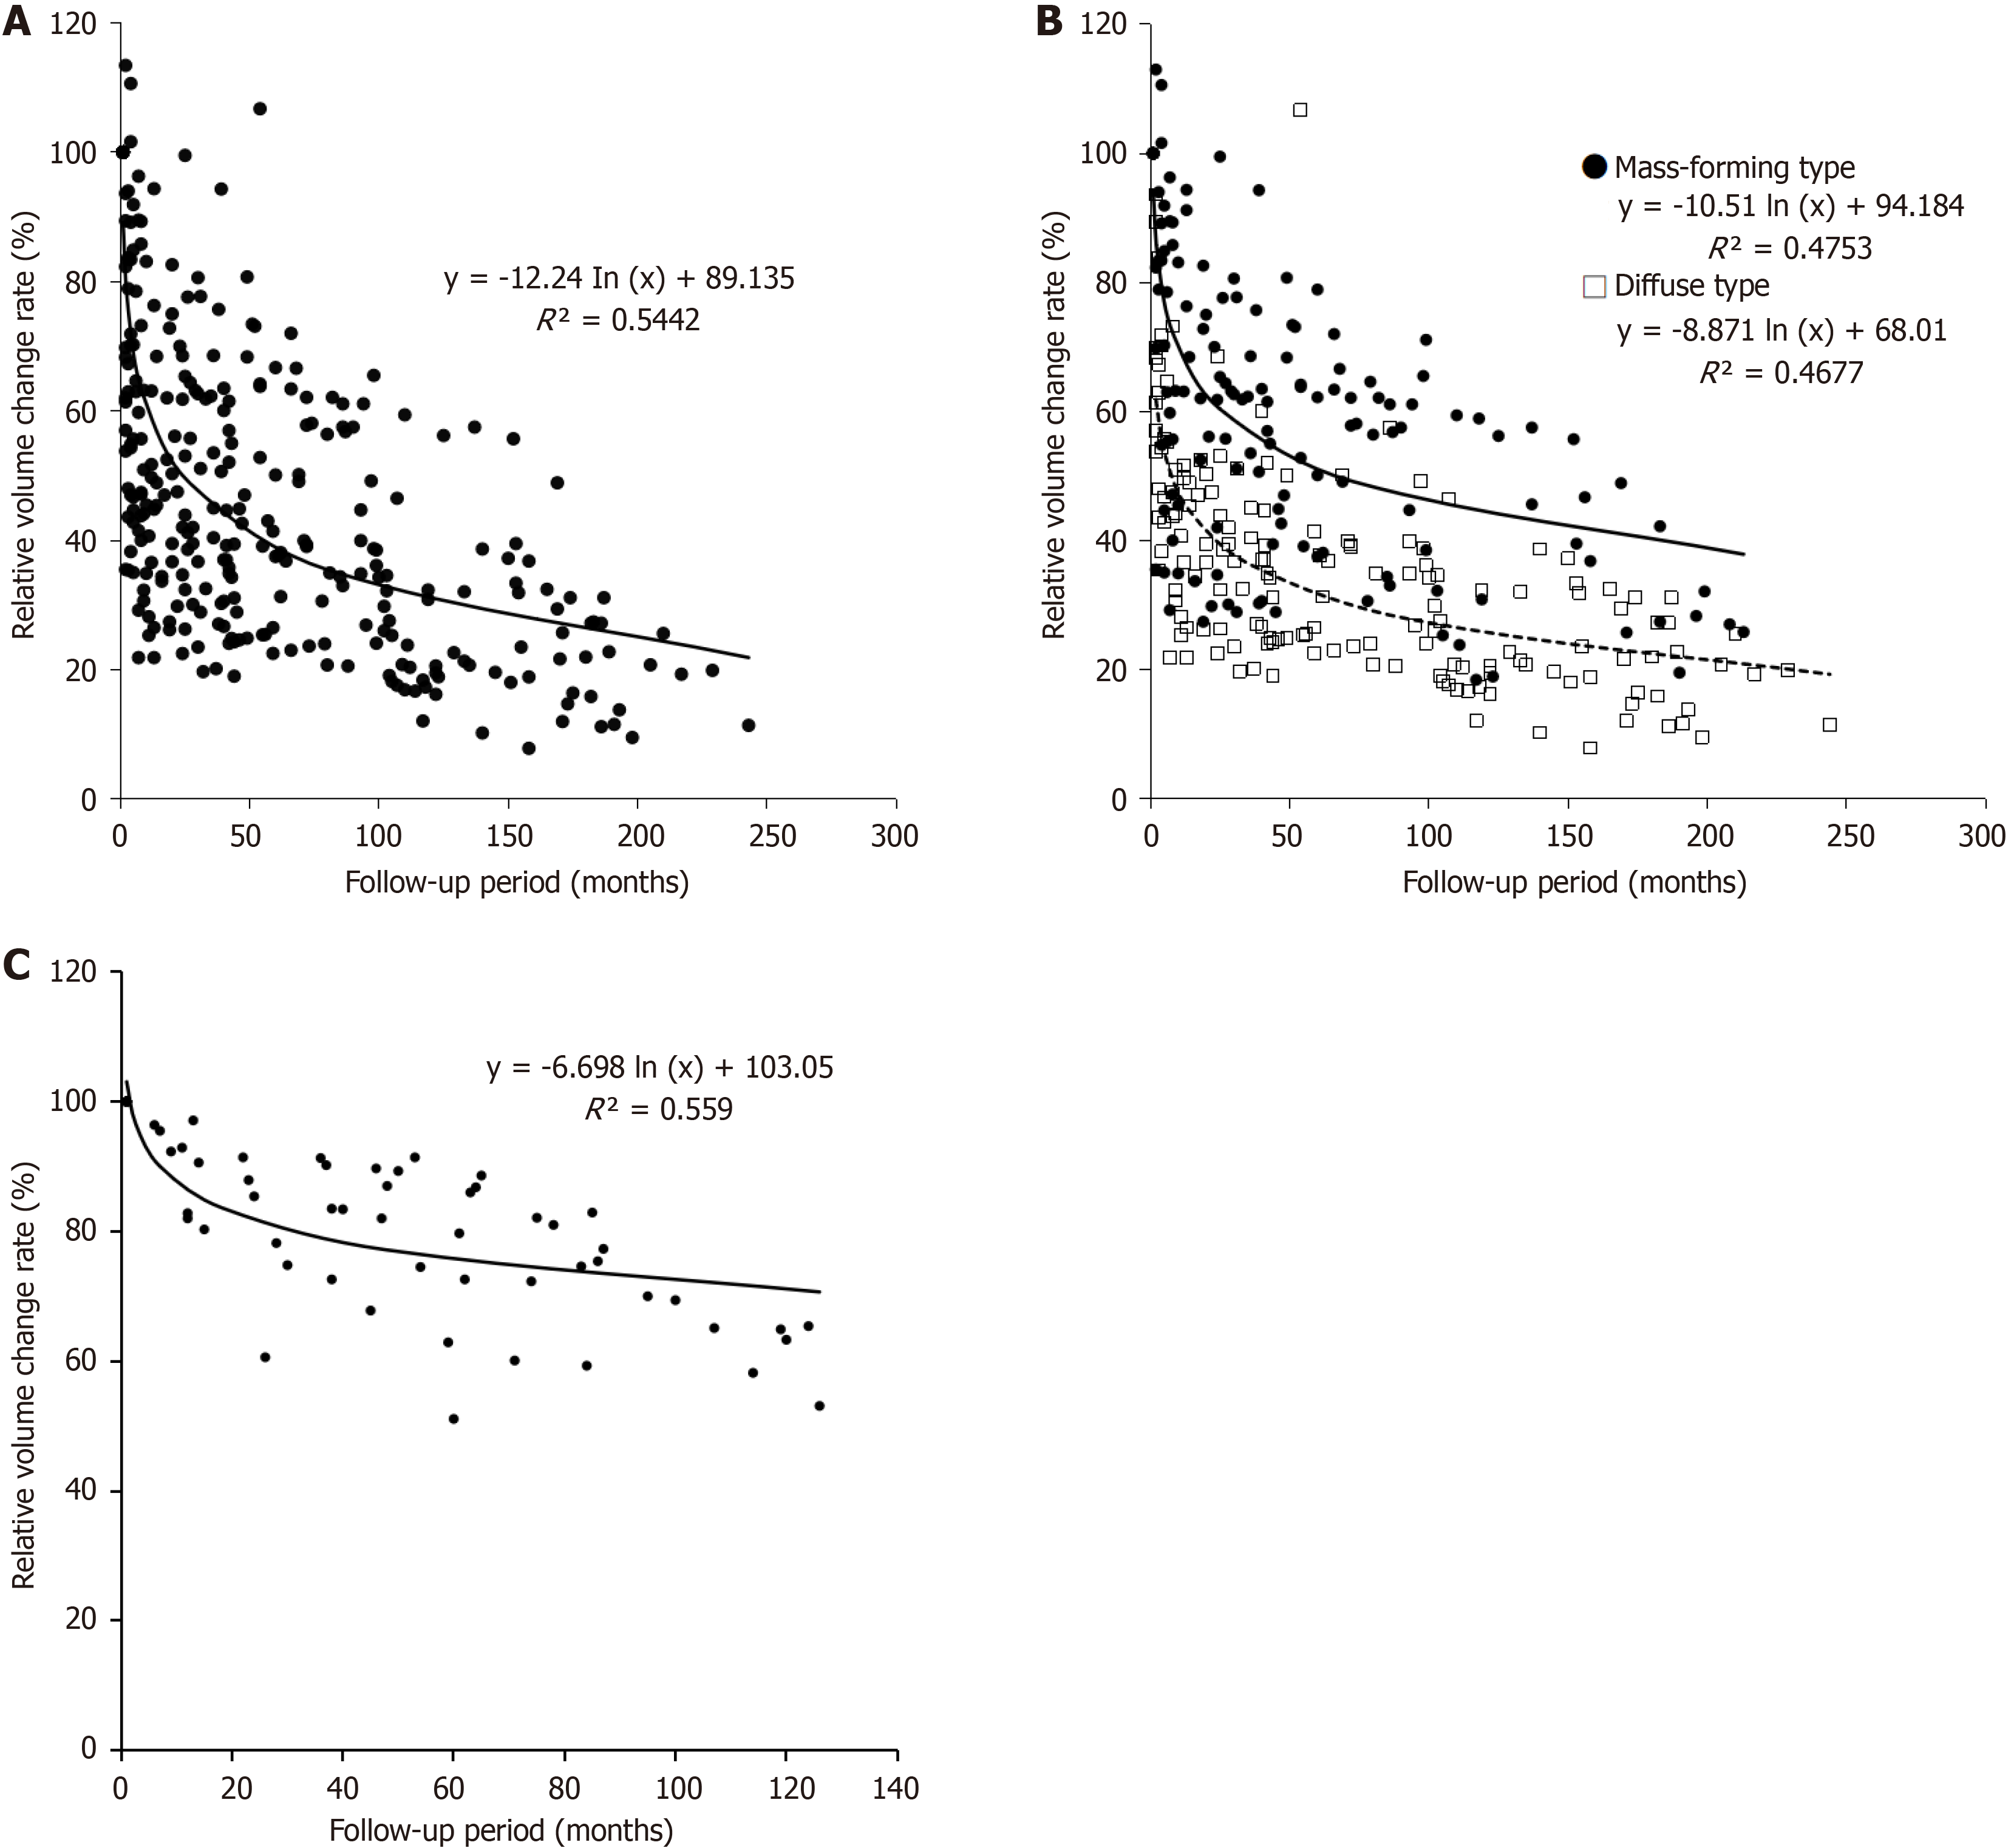
Figure 2 Scatter plot and regression curve.
A: Relationship between relative volume change of pancreas and follow-up period in all 33 patients with type-1 autoimmune pancreatitis. Mean relative volume change reduced exponentially and rapidly during the first 25 months of follow-up and then more slowly; B: Diffuse (D-) and mass-forming (M-) types resembled the overall regression curve. The regression curve was lower for patients with D-type compared with M-type autoimmune pancreatitis; C: Relative pancreatic volume change decreased gradually and slightly over time during long-term follow-up in 10 control subjects with normal pancreas.
- Citation: Shimada R, Yamada Y, Okamoto K, Murakami K, Motomura M, Takaki H, Fukuzawa K, Asayama Y. Pancreatic volume change using three dimensional-computed tomography volumetry and its relationships with diabetes on long-term follow-up in autoimmune pancreatitis. World J Radiol 2024; 16(11): 644-656
- URL: https://www.wjgnet.com/1949-8470/full/v16/i11/644.htm
- DOI: https://dx.doi.org/10.4329/wjr.v16.i11.644


