Copyright
©The Author(s) 2024.
World J Radiol. Oct 28, 2024; 16(10): 497-511
Published online Oct 28, 2024. doi: 10.4329/wjr.v16.i10.497
Published online Oct 28, 2024. doi: 10.4329/wjr.v16.i10.497
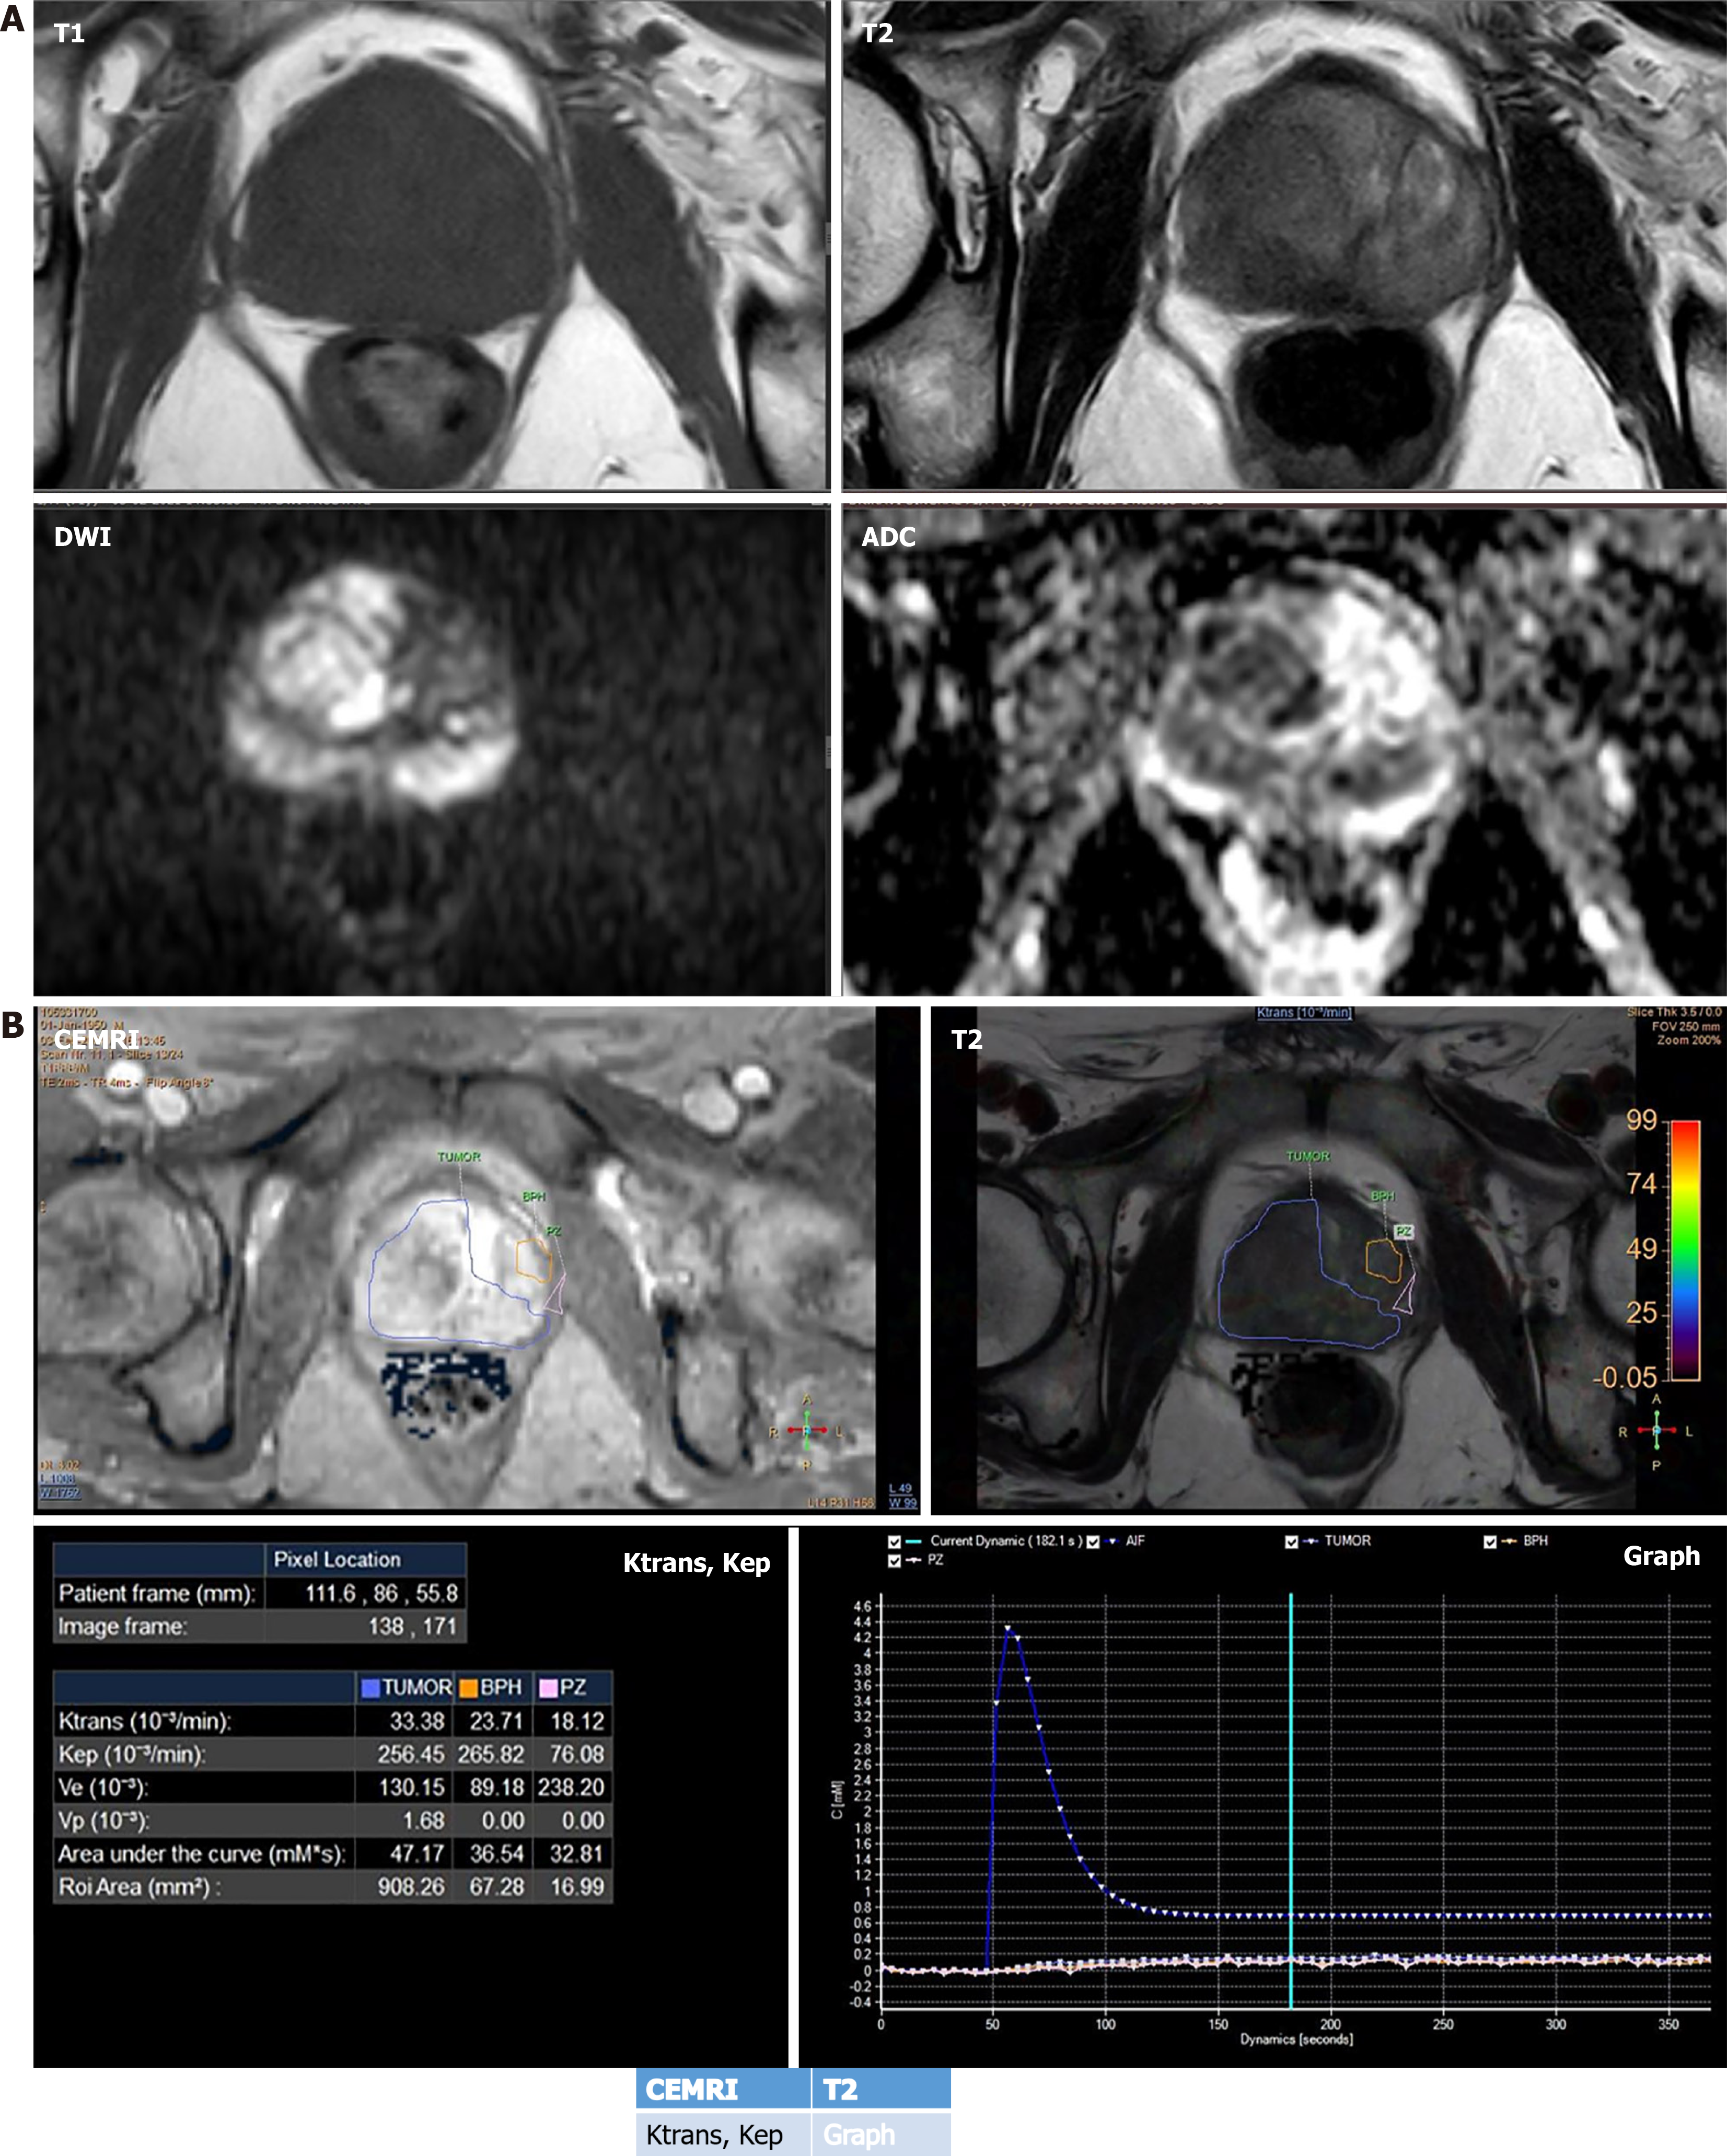
Figure 5 Dynamic contrast-enhanced magnetic resonance imaging based parameters.
A: Multiphasic magnetic resonance imaging images show PIRAD 5 lesion in right transitional zone, peripheral zone and left peripheral zone (asterisk); B: Dynamic contrast-enhanced magnetic resonance imaging images show various quantitative parameters. Region of interest has been drawn depicting prostatic cancer and benign prostatic hyperplasia (BPH) nodule. The table in B demonstrates higher Ktrans and Ve value in the prostatic cancer region as compared to BPH nodule. While Kep value is lower in the prostatic cancer region as compared to BPH nodule. The qualitative signal intensity curve in B demonstrates rapid wash in (steeper slope) and fast wash out in prostatic cancer region which is the characteristic curve for malignant tumors.
- Citation: Dhiman A, Kumar V, Das CJ. Quantitative magnetic resonance imaging in prostate cancer: A review of current technology. World J Radiol 2024; 16(10): 497-511
- URL: https://www.wjgnet.com/1949-8470/full/v16/i10/497.htm
- DOI: https://dx.doi.org/10.4329/wjr.v16.i10.497


