Copyright
©The Author(s) 2023.
World J Radiol. Nov 28, 2023; 15(11): 304-314
Published online Nov 28, 2023. doi: 10.4329/wjr.v15.i11.304
Published online Nov 28, 2023. doi: 10.4329/wjr.v15.i11.304
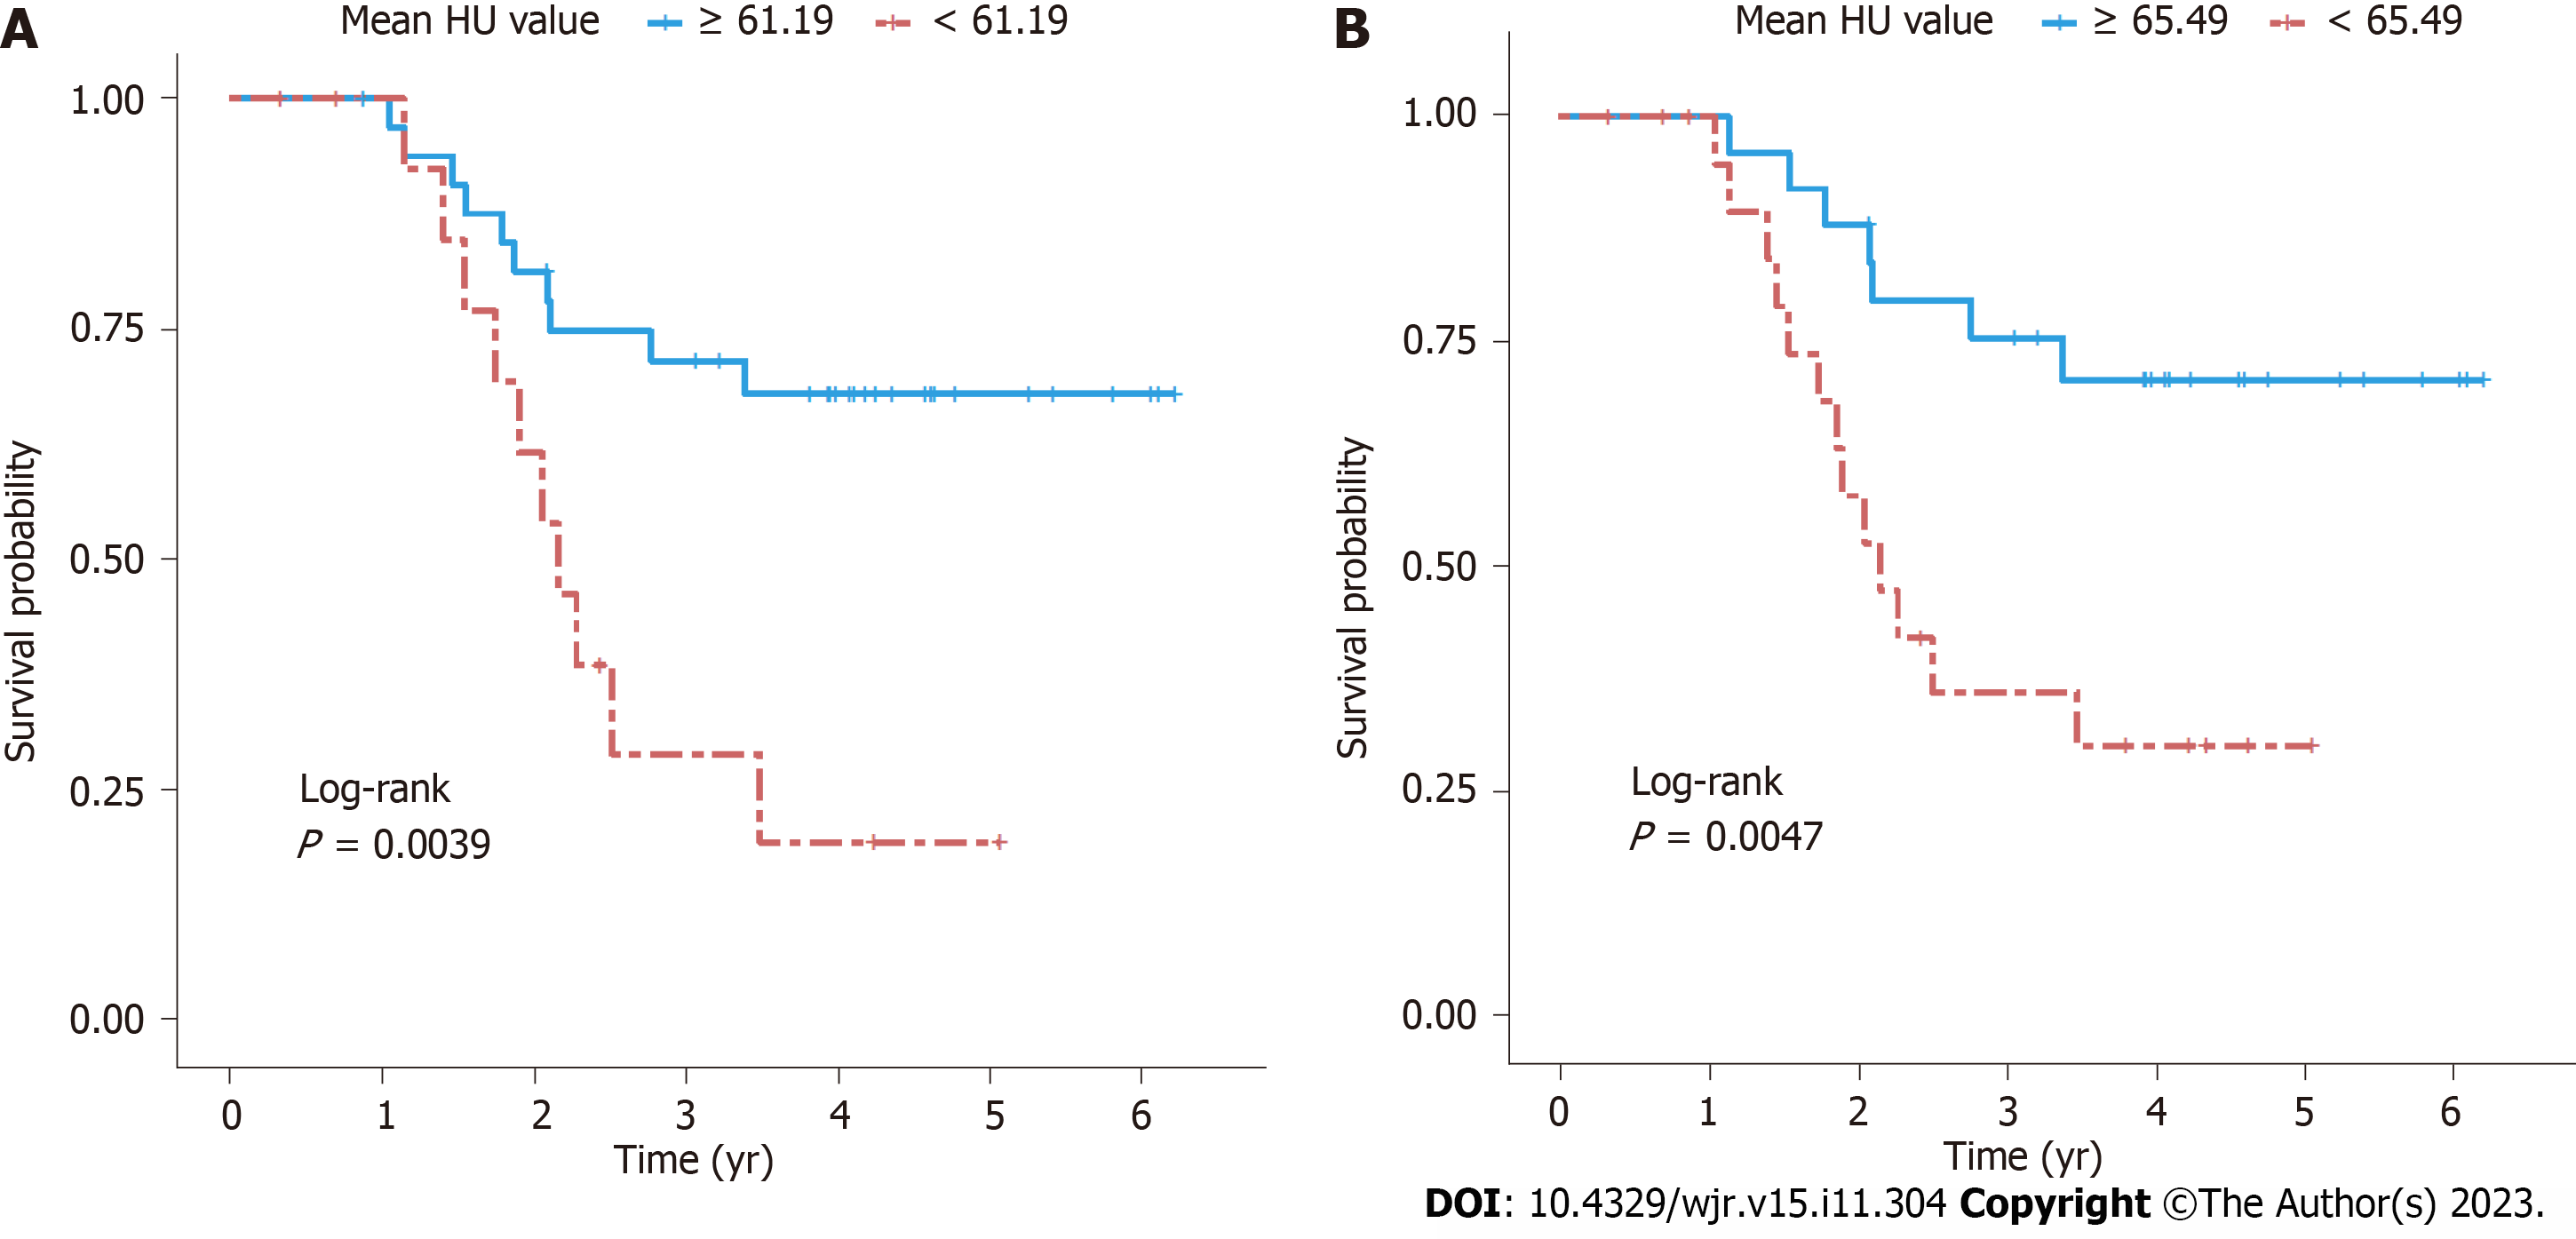
Figure 5 Kaplan-Meier curves.
A: Kaplan-Meier curves comparing patients with mean Hounsfield units (HU) value greater or less than 61.185, based on 3-dimensional analysis. Log-rank P = 0.0039 indicates that patients with mean HU ≥ 61.185 had significantly better overall survival than those with mean HU < 61.185; B: Kaplan-Meier curves comparing patients with mean HU value greater or less than 65.485, based on 2-dimensional analysis. Log-rank P = 0.0047 indicates that patients with mean HU ≥ 65.485 had significantly better overall survival than those with mean HU < 65.485. HU: Hounsfield units.
- Citation: Saleh M, Virarkar M, Mahmoud HS, Wong VK, Gonzalez Baerga CI, Parikh M, Elsherif SB, Bhosale PR. Radiomics analysis with three-dimensional and two-dimensional segmentation to predict survival outcomes in pancreatic cancer. World J Radiol 2023; 15(11): 304-314
- URL: https://www.wjgnet.com/1949-8470/full/v15/i11/304.htm
- DOI: https://dx.doi.org/10.4329/wjr.v15.i11.304


