Copyright
©The Author(s) 2022.
World J Radiol. Aug 28, 2022; 14(8): 256-271
Published online Aug 28, 2022. doi: 10.4329/wjr.v14.i8.256
Published online Aug 28, 2022. doi: 10.4329/wjr.v14.i8.256
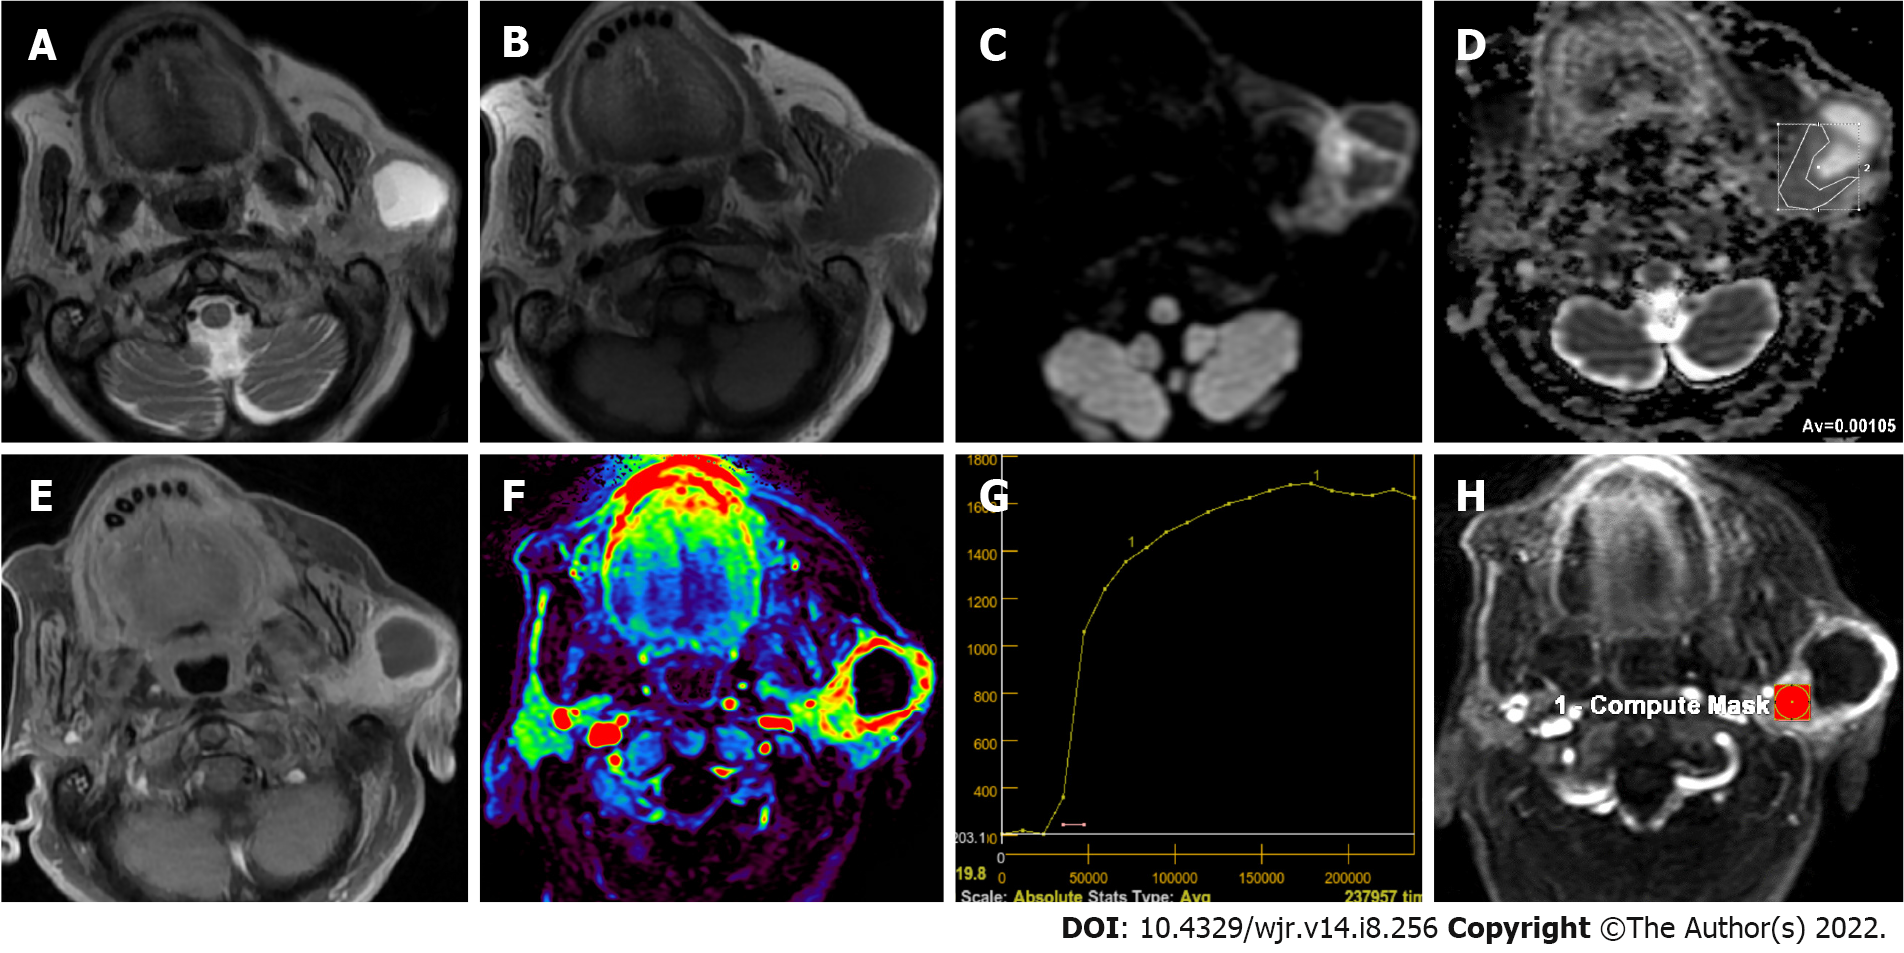
Figure 5 Eighty-seven years old female patient with squamous cell carcinoma infiltrating into the left parotid gland.
A: T2-weighted image shows a mass with a large cystic component; B: The lesion is hypointense on T1-weighted image; C: Solid component of the mass appears to be slightly hyperintens on the diffusion-weighted image; D: The apparent diffusion coefficient (ADC) value of the solid component of mass was 1.05 × 10⁻³ mm2/sec on the ADC; E: There was intense contrast enhancement of the solid component of mass on the contrast-enhanced image; F: On the color-coded perfusion magnetic resonance imaging, hyperperfused areas are seen in the solid component of the mass; G: On the time intensity curve of mass, progressive enhancement is seen towards the late phases. H: Ktrans was measured on quantitative dynamic contrast-enhanced magnetic resonance imaging.
- Citation: Gökçe E, Beyhan M. Advanced magnetic resonance imaging findings in salivary gland tumors. World J Radiol 2022; 14(8): 256-271
- URL: https://www.wjgnet.com/1949-8470/full/v14/i8/256.htm
- DOI: https://dx.doi.org/10.4329/wjr.v14.i8.256


