Copyright
©The Author(s) 2022.
World J Radiol. Jun 28, 2022; 14(6): 137-150
Published online Jun 28, 2022. doi: 10.4329/wjr.v14.i6.137
Published online Jun 28, 2022. doi: 10.4329/wjr.v14.i6.137
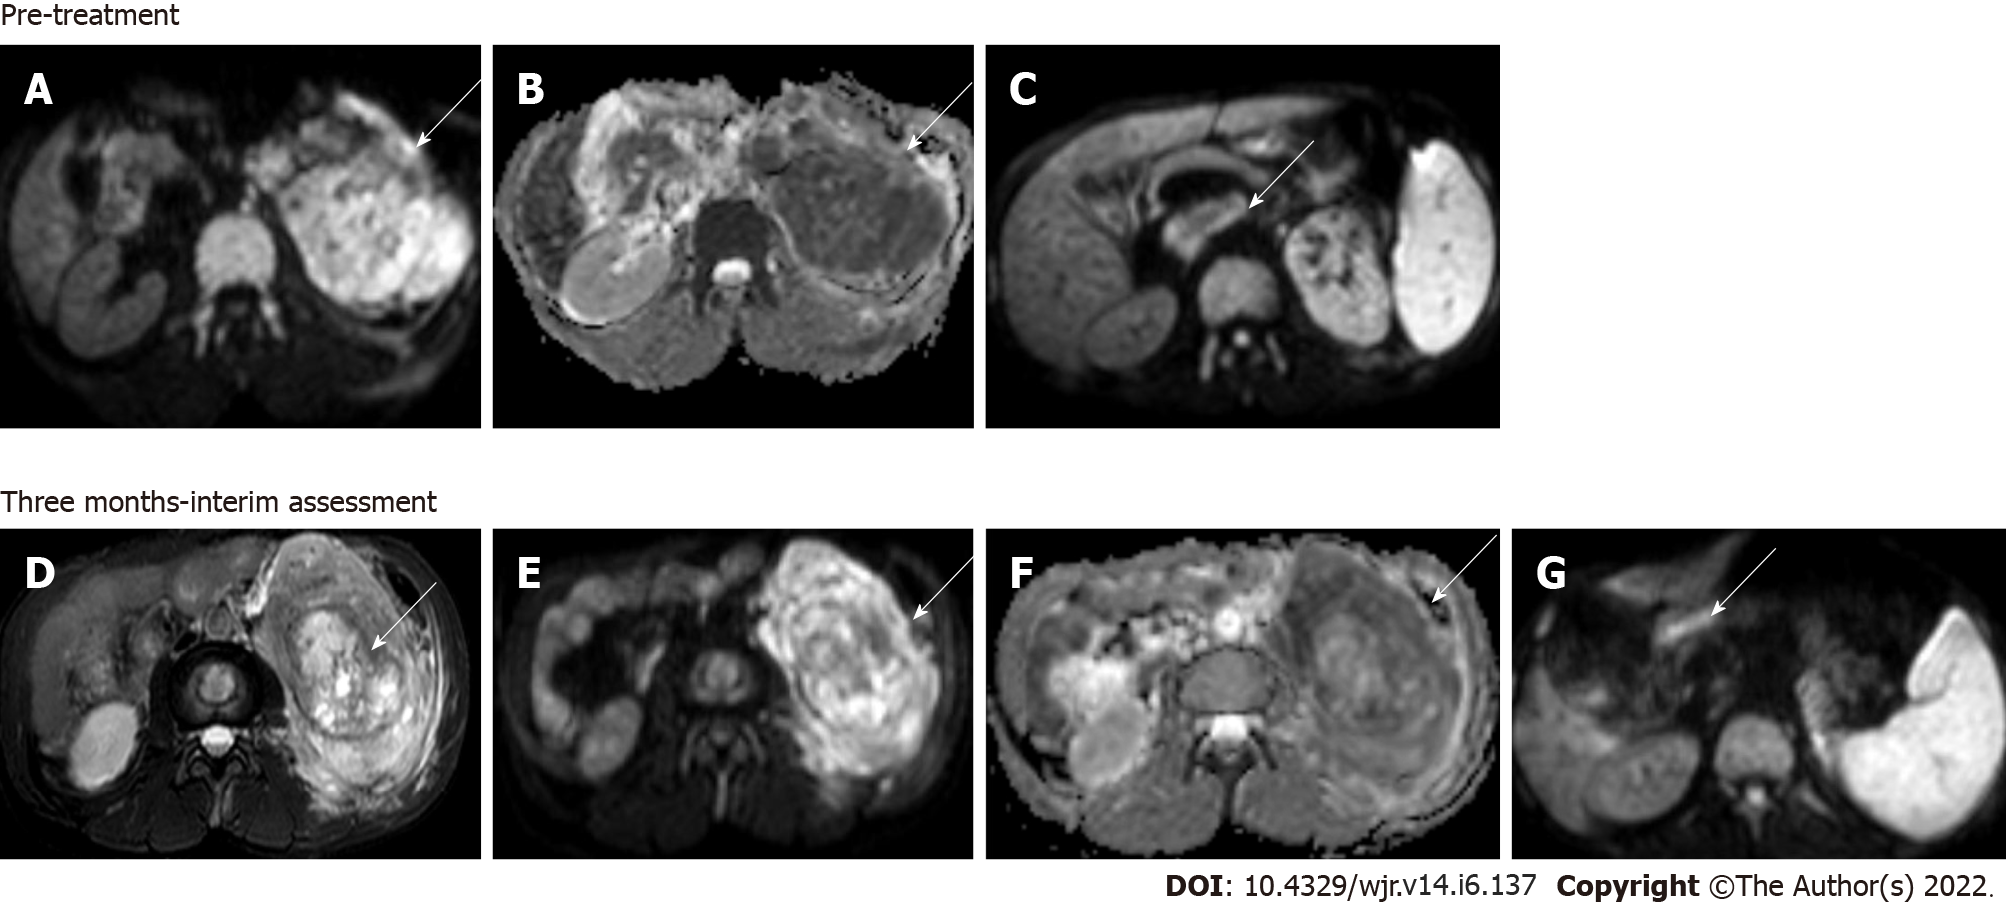
Figure 6 Magnetic resonance images.
Diffusion-weighted imaging (DWI) at b = 800 s/mm2 (A) and apparent diffusion coefficient (ADC) map (B) showed large clear cell renal cell carcinoma replacing the left kidney showing markedly restricted diffusion; DWI image (C) showing a malignant thrombus extending to the inferior vena cava (arrow) Axial T2W FS image (D) showing that 3 mo after treatment with sorafenib (a tyrosine kinase inhibitor), there was no significant change in the size of the lesion; however, there was increased necrosis in the mass; Resultant increase in ADC value on the corresponding DWI at b = 800 s/mm2 (E) and ADC map (F); DWI (G) also revealed partial recanalization of the malignant thrombus (arrow)—overall features suggestive of partial response.
- Citation: Aggarwal A, Das CJ, Sharma S. Recent advances in imaging techniques of renal masses. World J Radiol 2022; 14(6): 137-150
- URL: https://www.wjgnet.com/1949-8470/full/v14/i6/137.htm
- DOI: https://dx.doi.org/10.4329/wjr.v14.i6.137


