Copyright
©The Author(s) 2022.
World J Radiol. Jun 28, 2022; 14(6): 114-136
Published online Jun 28, 2022. doi: 10.4329/wjr.v14.i6.114
Published online Jun 28, 2022. doi: 10.4329/wjr.v14.i6.114
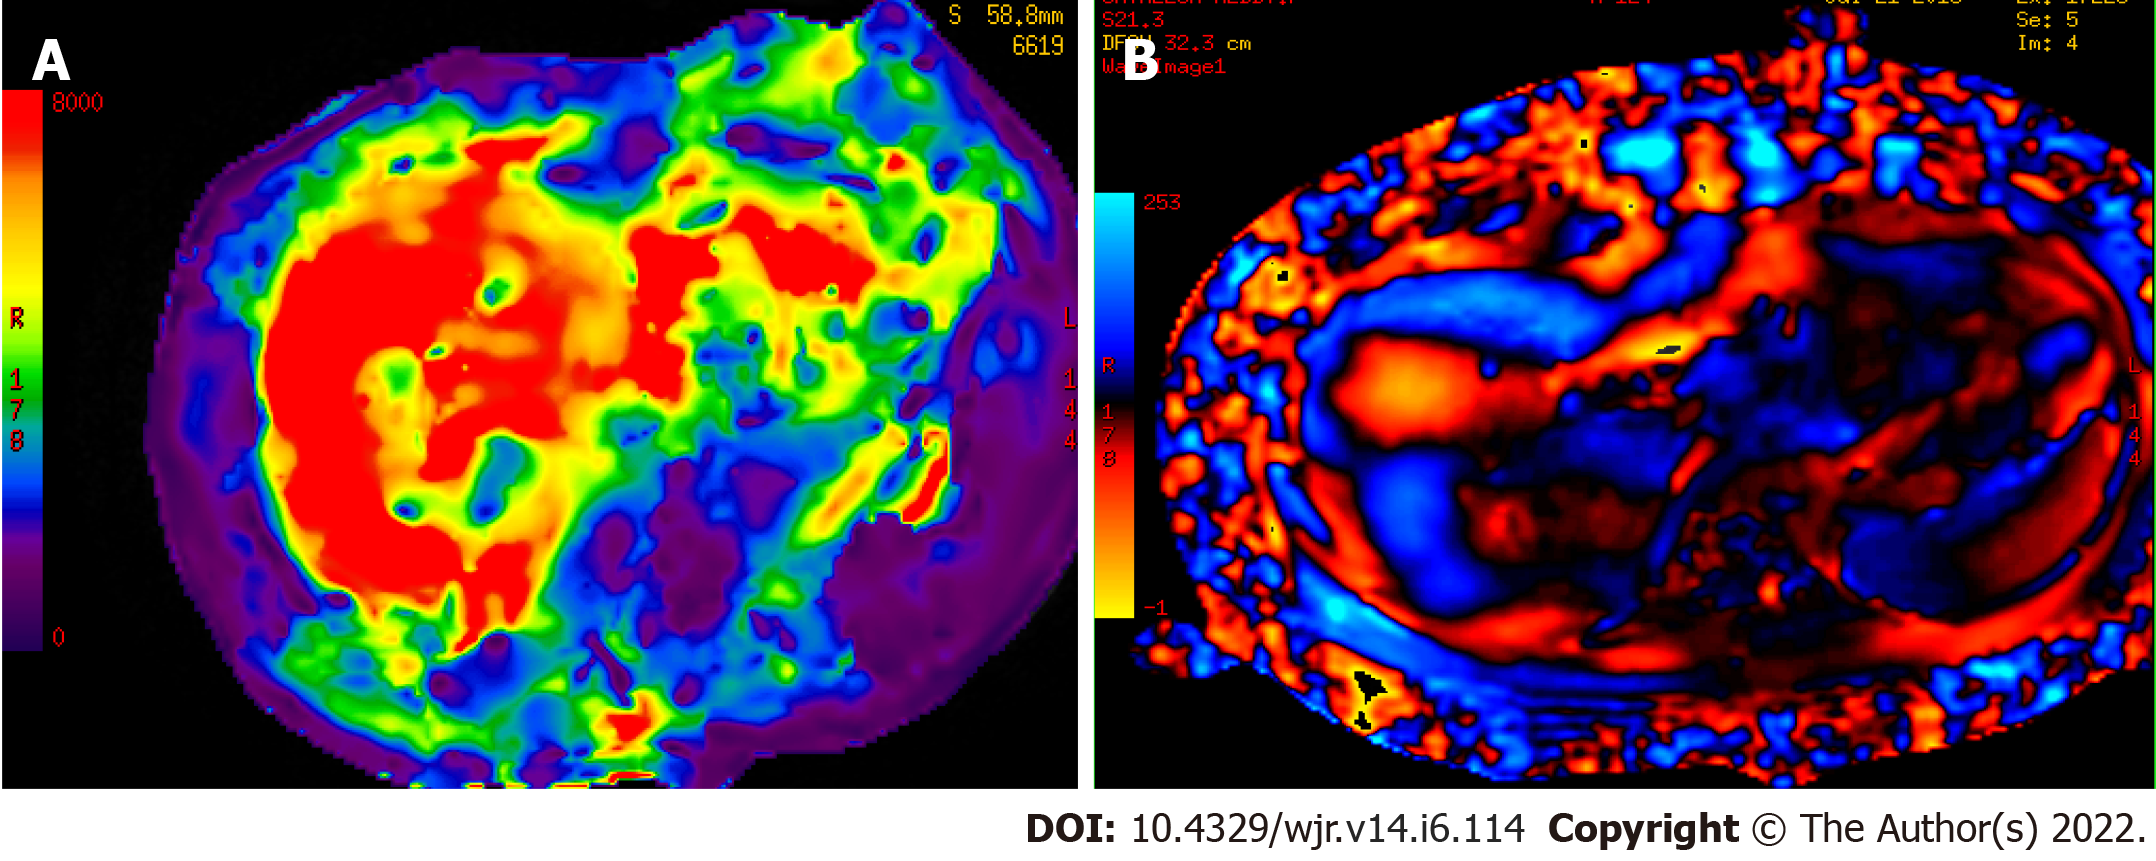
Figure 11 Post tuberculosis medication liver fibrosis on magnetic resonance elastography.
A: Color elastogram of liver with a 0-8kPa scale shows the stiffness distribution in organs for qualitative evaluation. Red or orange regions have higher stiffness values, whereas blue and purple regions are depictive of lower stiffness values. Severe Liver fibrosis is noted - 8.1kPa; B: Wave image of liver shows excellent wave propagation anteriorly and laterally. Low amplitude waves with wave distortion observed in segment VII and II of liver. Images courtesy Dr. Bhaskar N, Vista Imaging Centre, Bangalore.
- Citation: Merchant SA, Shaikh MJS, Nadkarni P. Tuberculosis conundrum - current and future scenarios: A proposed comprehensive approach combining laboratory, imaging, and computing advances. World J Radiol 2022; 14(6): 114-136
- URL: https://www.wjgnet.com/1949-8470/full/v14/i6/114.htm
- DOI: https://dx.doi.org/10.4329/wjr.v14.i6.114


