Copyright
©The Author(s) 2022.
World J Radiol. Feb 28, 2022; 14(2): 30-46
Published online Feb 28, 2022. doi: 10.4329/wjr.v14.i2.30
Published online Feb 28, 2022. doi: 10.4329/wjr.v14.i2.30
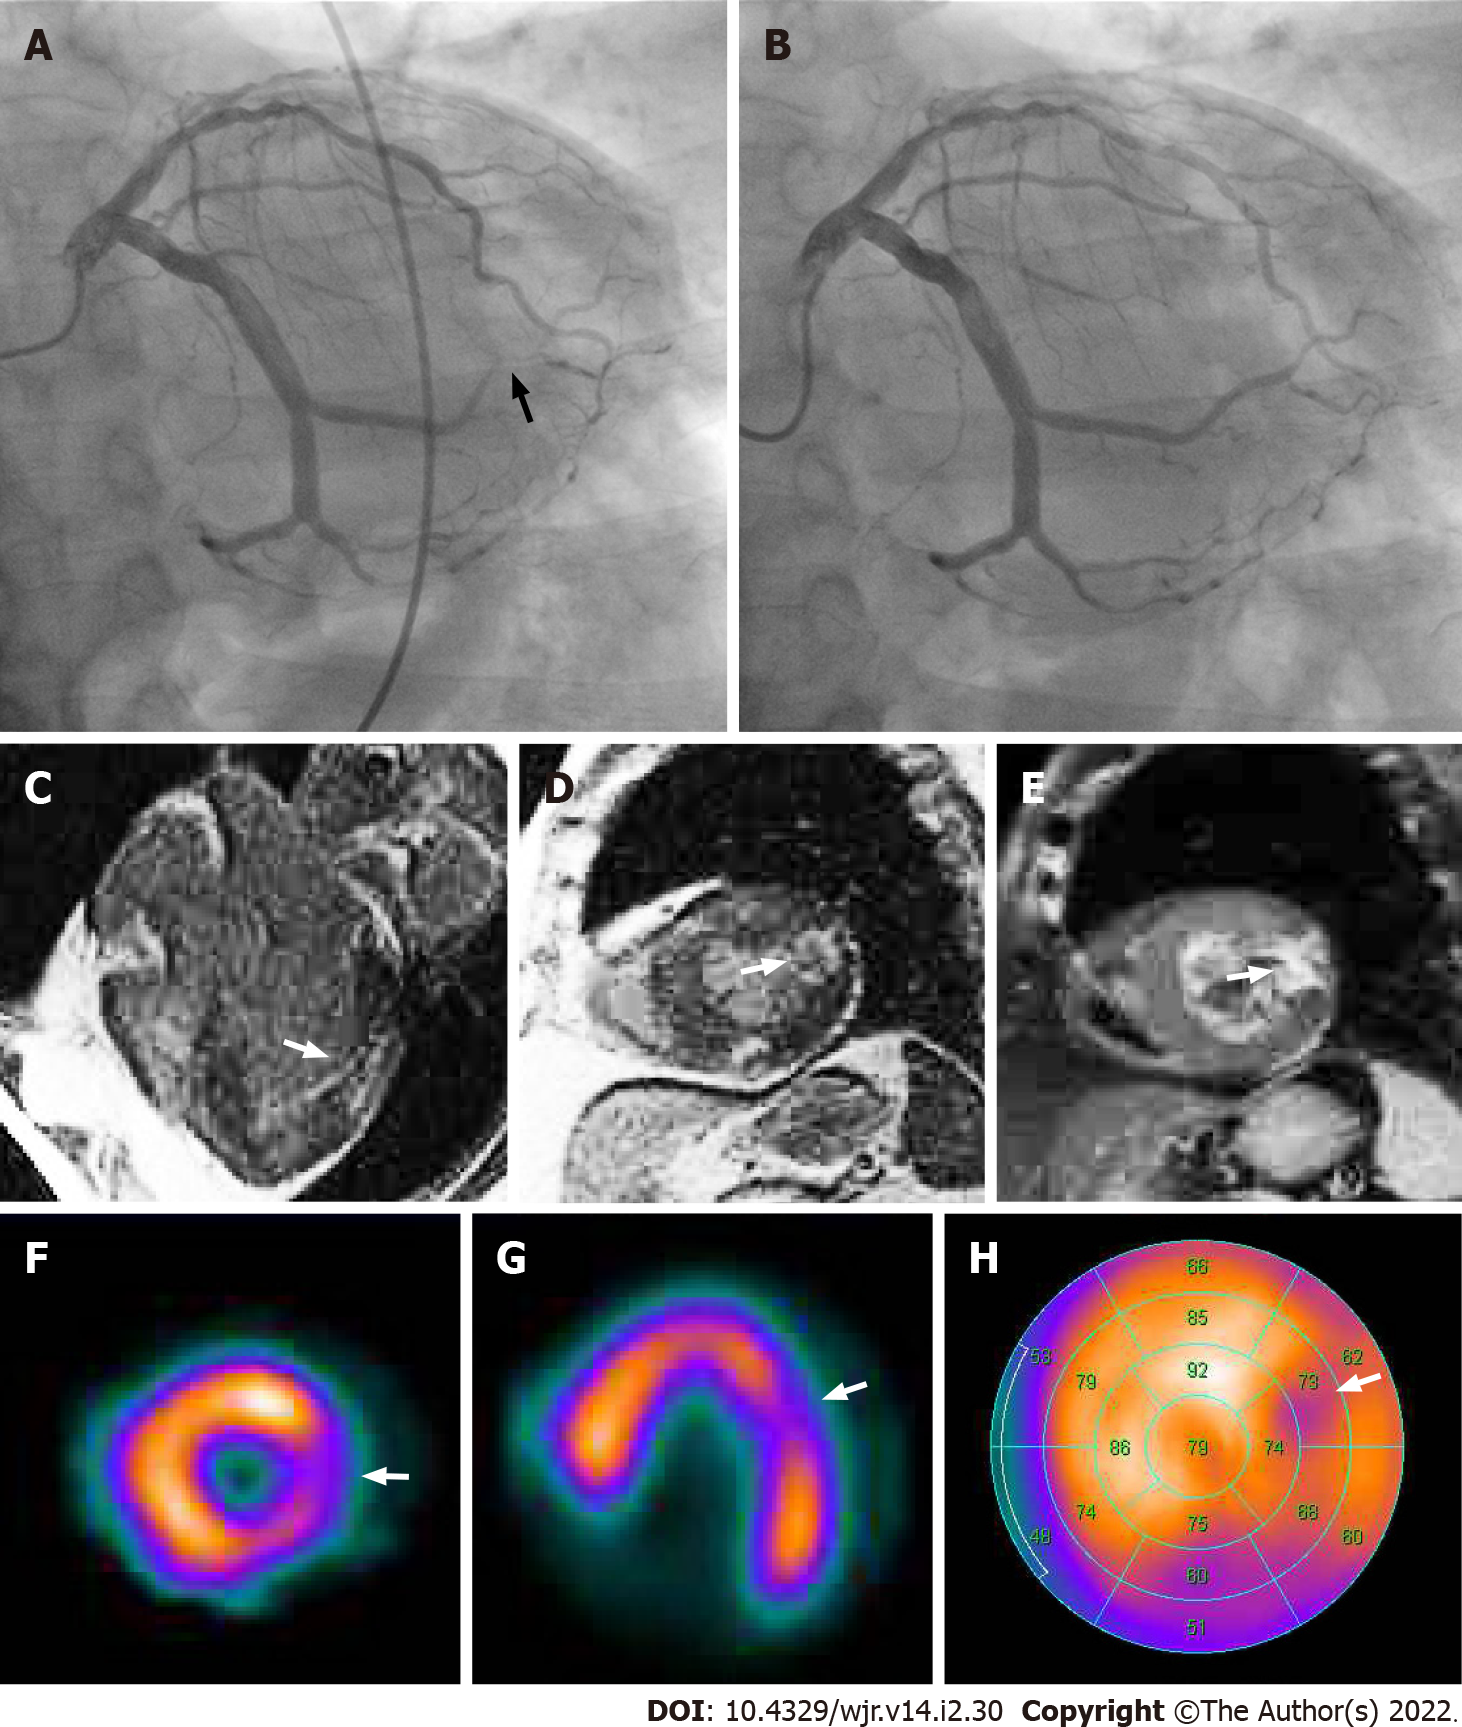
Figure 7 Corresponding invasive coronary angiography, cardiac magnetic resonance imaging and tetrofosmin single-photon emission computed tomography in acute coronary syndrome of left circumflex coronary artery.
Same patient as Figure 6. A: Invasive coronary angiography showed 99% stenosis in the posterolateral branch of the left circumflex coronary artery (arrow). B: Subsequent percutaneous coronary intervention was performed by balloon angioplasty and stent implantation. His laboratory data showed elevation of cardiac biomarkers (creatine kinase 1620 IU/L, creatine kinase MB 120 IU/L). Horizontal long axis (C) and short axis (D) views of the contrast-enhanced cardiac magnetic resonance imaging (MRI) showed late gadolinium enhancement in the mid lateral wall of the left ventricle (arrow). A short axis view of the T2-weighted cardiac MRI showed high signal intensity in the mid lateral wall of the left ventricle (E, arrow). Short axis (F) and horizontal long axis (G) views and a bull’s eye polar plot (H) of rest technetium-99m tetrofosmin single-photon emission computed tomography myocardial perfusion imaging showed hypoperfusion in the mid lateral wall of the left ventricle (arrows).
- Citation: Yoshihara S. Acute coronary syndrome on non-electrocardiogram-gated contrast-enhanced computed tomography. World J Radiol 2022; 14(2): 30-46
- URL: https://www.wjgnet.com/1949-8470/full/v14/i2/30.htm
- DOI: https://dx.doi.org/10.4329/wjr.v14.i2.30


