Copyright
©The Author(s) 2020.
World J Radiol. Aug 28, 2020; 12(8): 184-194
Published online Aug 28, 2020. doi: 10.4329/wjr.v12.i8.184
Published online Aug 28, 2020. doi: 10.4329/wjr.v12.i8.184
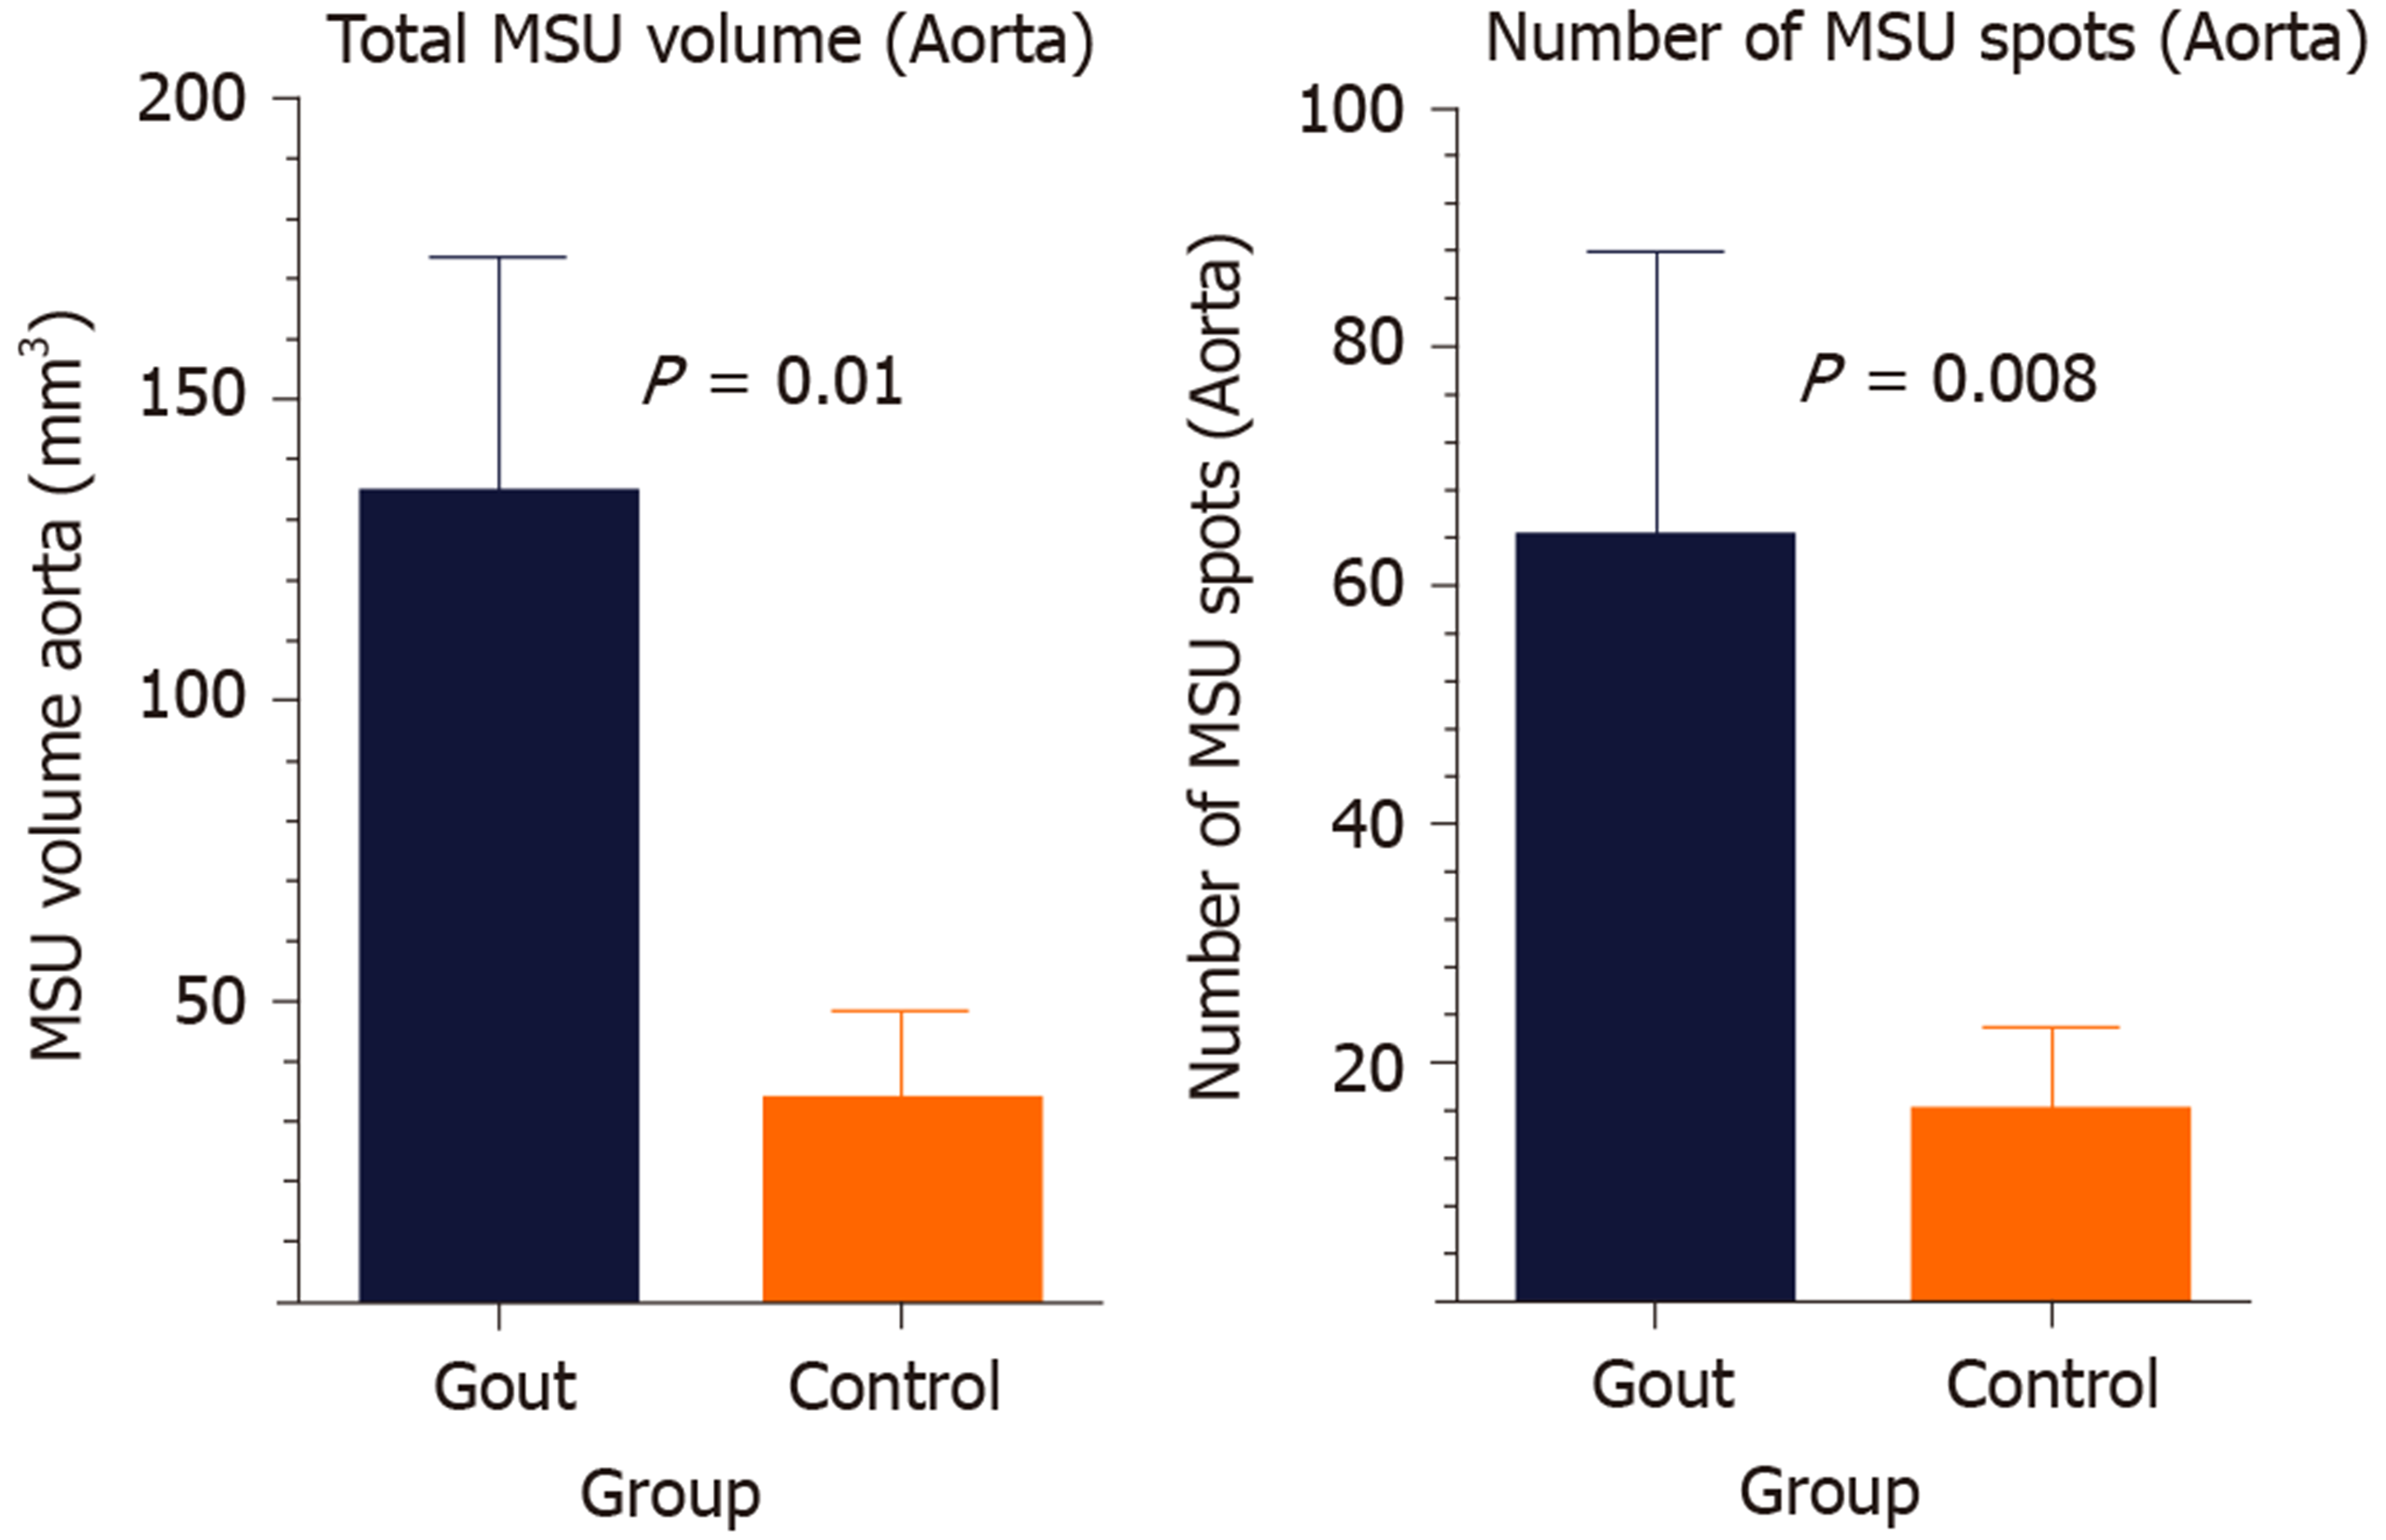
Figure 2 Plots showing total volume of green coded areas (urate deposition) within the aorta (mean ± SD) (Left).
Number of green deposits/spots in the aortas of gout and control subjects (mean ± SD) (Right). MSU: Monosodium urate.
- Citation: Barazani SH, Chi WW, Pyzik R, Chang H, Jacobi A, O’Donnell T, Fayad ZA, Ali Y, Mani V. Quantification of uric acid in vasculature of patients with gout using dual-energy computed tomography. World J Radiol 2020; 12(8): 184-194
- URL: https://www.wjgnet.com/1949-8470/full/v12/i8/184.htm
- DOI: https://dx.doi.org/10.4329/wjr.v12.i8.184


