Copyright
©The Author(s) 2020.
World J Radiol. Jun 28, 2020; 12(6): 87-100
Published online Jun 28, 2020. doi: 10.4329/wjr.v12.i6.87
Published online Jun 28, 2020. doi: 10.4329/wjr.v12.i6.87
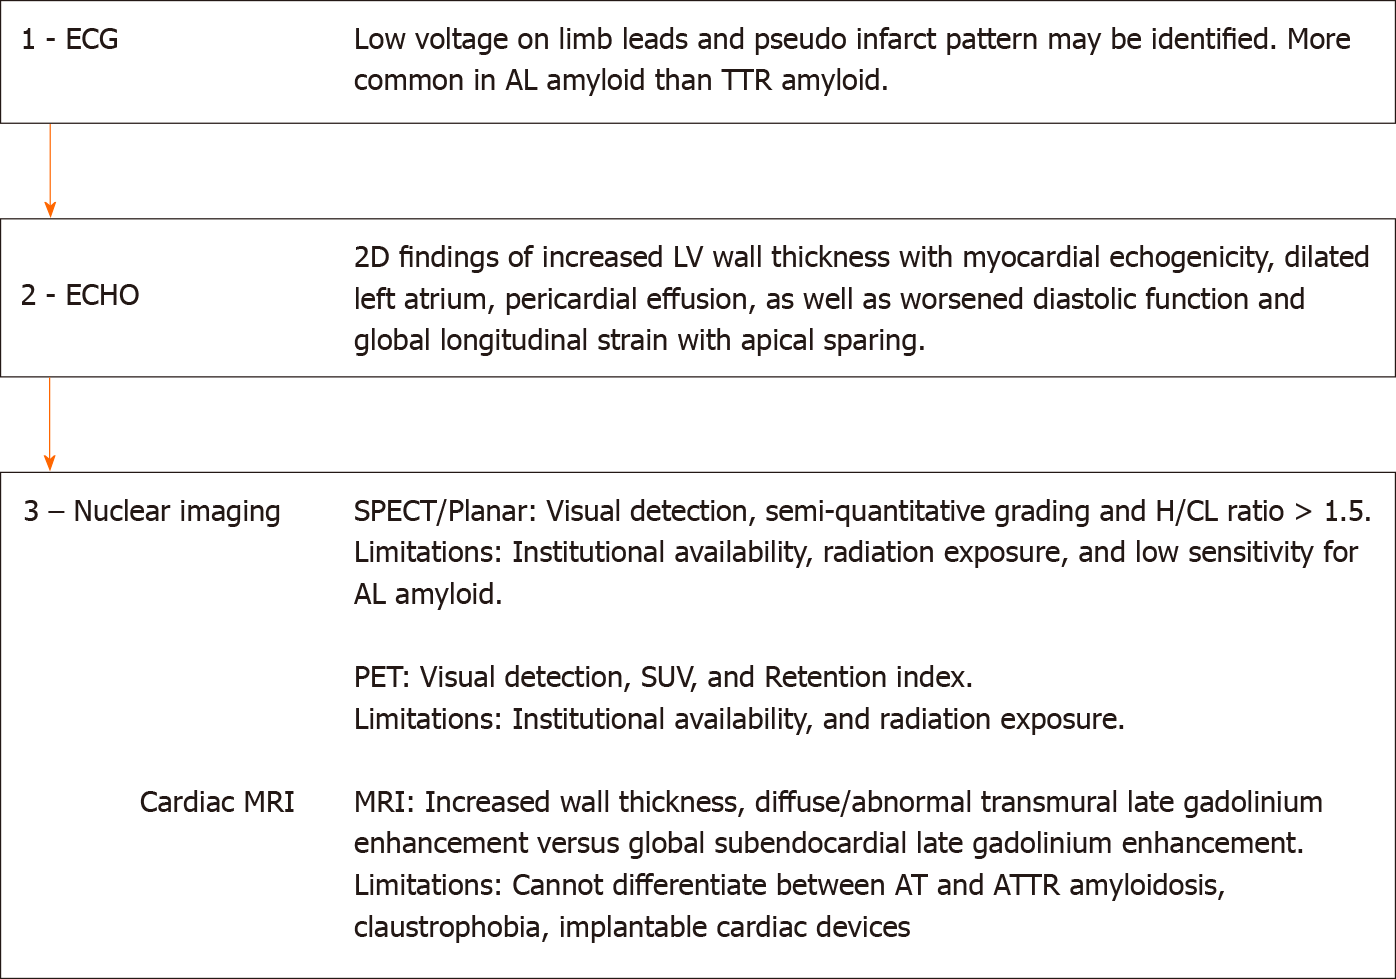
Figure 5 Schematic diagram of the stepwise use of electrocardiogram and multi-modality imaging in the diagnosis and evaluation of cardiac amyloidosis.
ECG: Electrocardiogram; AL: Light chain amyloidosis; TTR: Transthyretin; ECHO: Echocardiogram; SPECT: Single-photon emission computerized tomography; H/CL: Heart-to-contralateral lung; PET: Positron-emission tomography; SUV: Standardized uptake value; MRI: Magnetic-resonance imaging; ATTR: Transthyretin amyloidosis.
- Citation: Wang TKM, Abou Hassan OK, Jaber W, Xu B. Multi-modality imaging of cardiac amyloidosis: Contemporary update. World J Radiol 2020; 12(6): 87-100
- URL: https://www.wjgnet.com/1949-8470/full/v12/i6/87.htm
- DOI: https://dx.doi.org/10.4329/wjr.v12.i6.87


